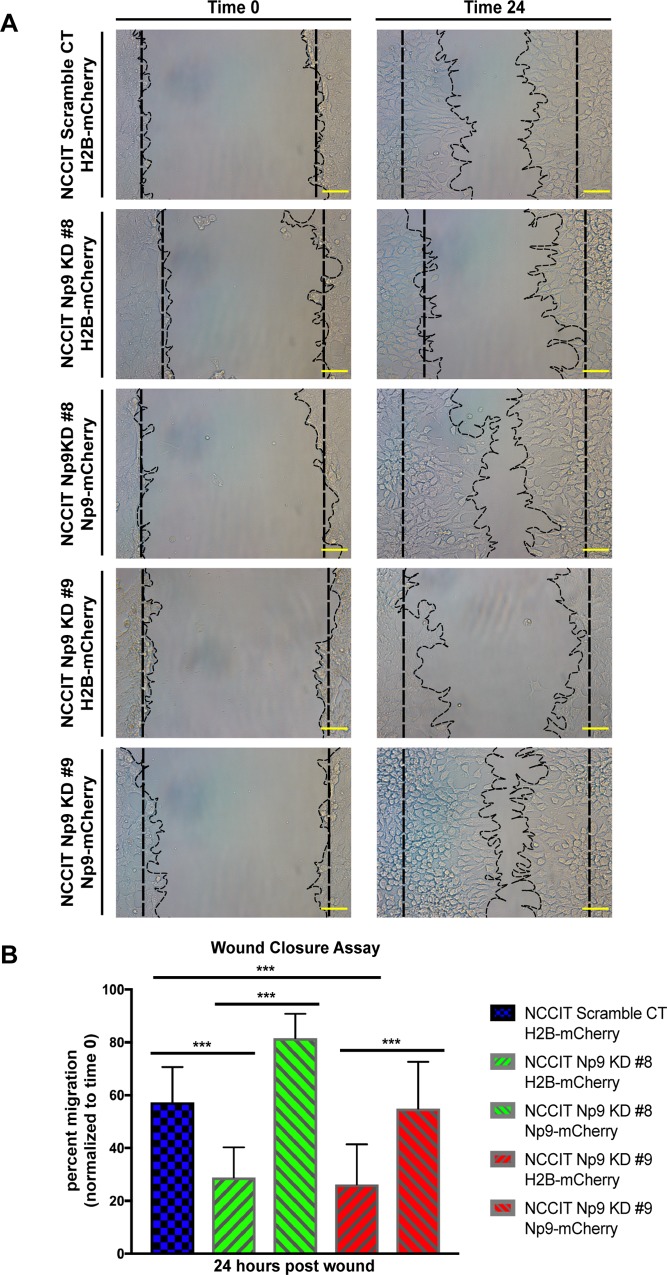
Fig 6. Re-introduction of Np9 into teratocarcinoma cells rescues the migration phenotype.
(A) NCCIT scramble, Np9 KD clones 8 and 9 with H2B-mCherry control clones and NCCIT Np9 KD clones 8 and 9 with Np9-mCherry clones were used for the migration assay. A total of 200,000 cells for each cell type were transferred into a 12-well plate. The following day, a scratch was created down the middle, and pictures were taken at time 0 and at 24 hours. The images are representative of 2 independent experiments done in duplicate. Scales bars, 100 μm. (B) The wound was measured at time 0 and at 24 hours. The percent of migration was plotted over time 0. The measurements are representative of 2 independent experiments done in duplicate. The width of the wound was measured for each sample: scramble CT-H2B-mCherry (n = 83), Np9 KD #8 H2B-mCherry (n = 135), Np9 KD #8 Np9-mCherry (n = 156), Np9 KD #9 H2B-mCherry (n = 160), and Np9 KD #9 Np9-mCherry (n = 145). The re-introduction of Np9 into Np9 KD cells rescued the migratory phenotype of the NCCIT cells almost to the level of the scramble control, and in the case of Np9 KD clone 8 complemented with Np9-mCherry, the re-introduction of Np9 resulted in faster migration compared to the scramble control. T bars denote the standard deviations of the means; P values were determined using student t-test analysis. ***P<0.0001.

