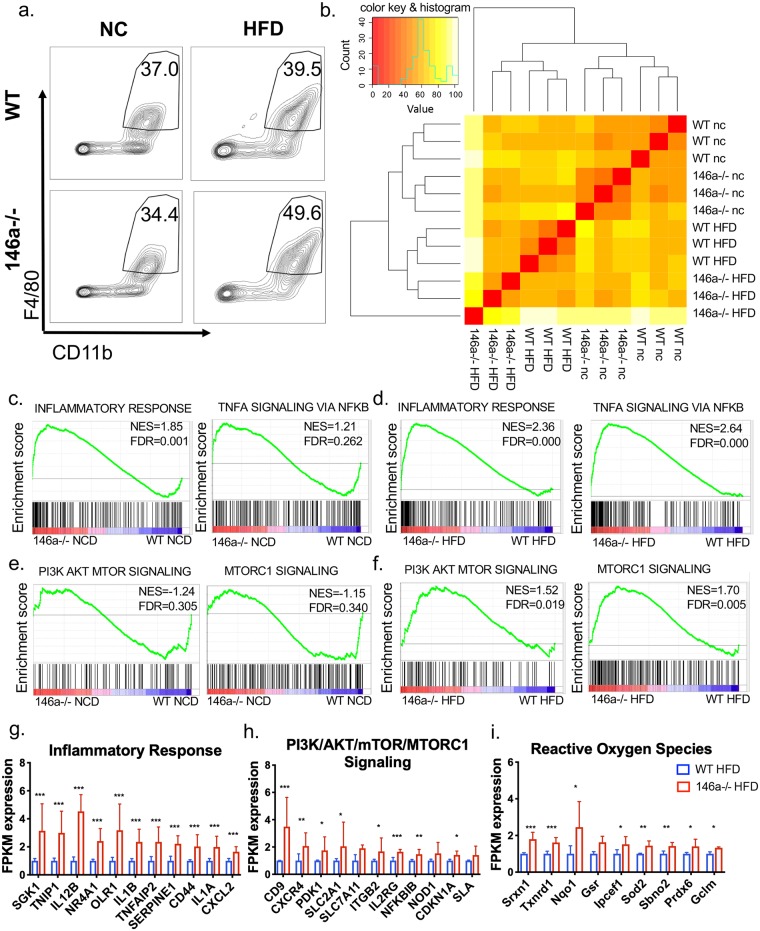
Fig 4. miR-146a regulates adipose tissue macrophage gene expression during NCD and HFD.
(A) Representative FACS plots of cells collected from the SVF of 20-week old WT and miR-146a-/- mice fed HFD or NCD. Cells were sorted for CD11b+ F4/80+ markers from live, singlet CD45+ cells. Numbers indicate percent cells in gate. (B) Heat map showing total gene expression of sorted ATMs from WT and miR-146a-/- mice fed NCD or HFD, as measured by RNA-seq. Red indicates 100% similarity in total RNA expression to compared sample; yellow indicates dissimilarity. (C-F) Gene Set Enrichment Analysis plots of miR-146a-/- (red) and WT (blue) mice showing (C) (left) enrichment of the ‘inflammatory response’ in miR-146a-/- mice during NCD, and (right) no statistical enrichment of ‘TNFa signaling via NFkB’ during NCD; (D) enrichment of the ‘inflammatory response’ and ‘TNFa signaling via NFkB’ in miR-146a-/- mice during HFD; (E) no statistical enrichment of ‘PI3K/AKT/mTOR signaling’ or ‘mTORC1 signaling’ during NCD; (F) enrichment of ‘PI3K/AKT/mTOR signaling’ and ‘mTORC1 signaling’ in miR-146a-/- mice during HFD. (g-i) Relative expression of the top hits within (G) the ‘inflammatory response’, (H) ‘PI3K/AKT/mTOR/mTORC1 signaling’, and (I) ‘Reactive oxygen species’ upregulated in miR-146a-/- ATMs compared to WT, as determined by RNA-seq. The WT FPKM averages were set to a relative expression value of 1, with data shown as mean±SD. p-value was calculated using two-tailed Student’s t-test. *p<0.05; **p<0.01; ***p<0.001; ns = not significant. NES = normalized enrichment score; FDR = false discovery rate, where FDR<0.25 is statistically significant. See also S5 Fig.

