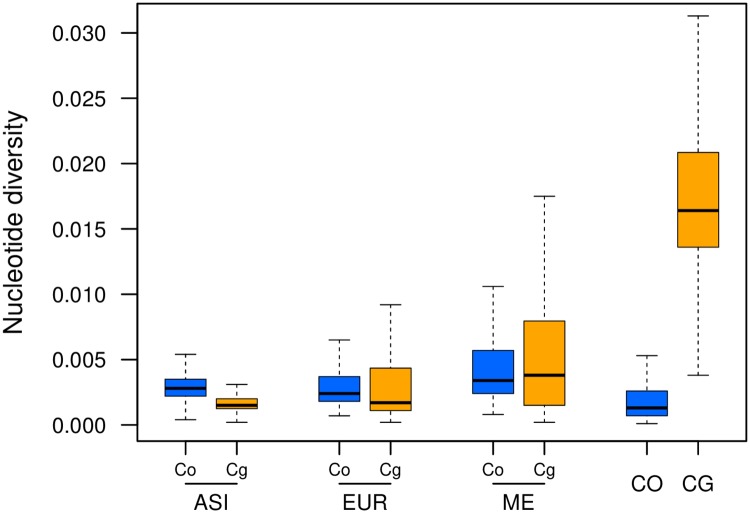
Fig 2. Variation in nucleotide diversity (π) between populations of C. bursa-pastoris and parental species.
This boxplot shows the distributions of π estimated along the genome using 100 Kb sliding windows. Co and Cg indicate C. orientalis and C. grandiflora / rubella descendant subgenomes, respectively. ASI, EUR ME, CO and CG correspond to Asian, European and Middle Eastern populations of C. bursa-pastoris, C. orientalis, and C. grandiflora, respectively.

