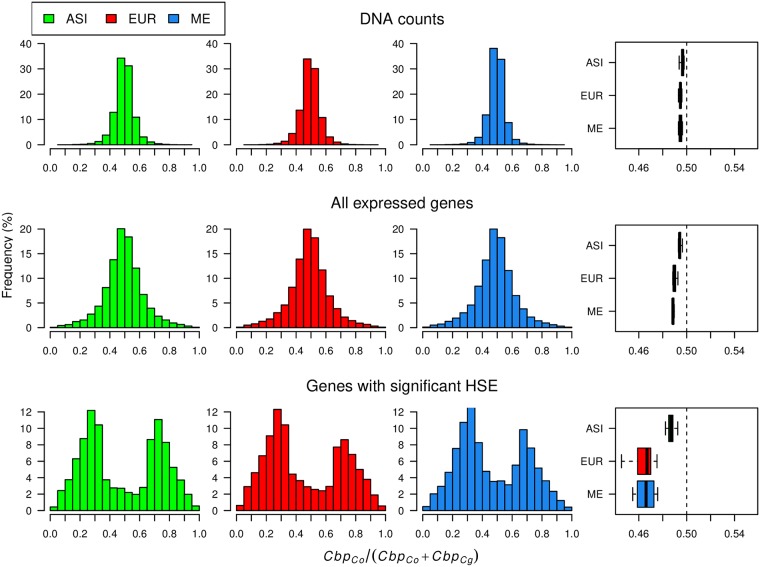
Fig 7. Distributions of expression ratios between the two subgenomes of C. bursa-pastoris.
The homeologue specific expression (HSE) is estimated by the fraction the CbpCo subgenome relative to the total expression level. The upper part presents the distributions for DNA counts, the middle plots show the expression for all assayed gene and the lower plot shows only the distribution for genes with significant HSE. The histograms present the distribution of the allelic ratio, whereas the boxplots summarize these results with the grand mean for every sample. ASI, EUR, and ME indicate Asian, European and Middle Eastern populations, respectively.

