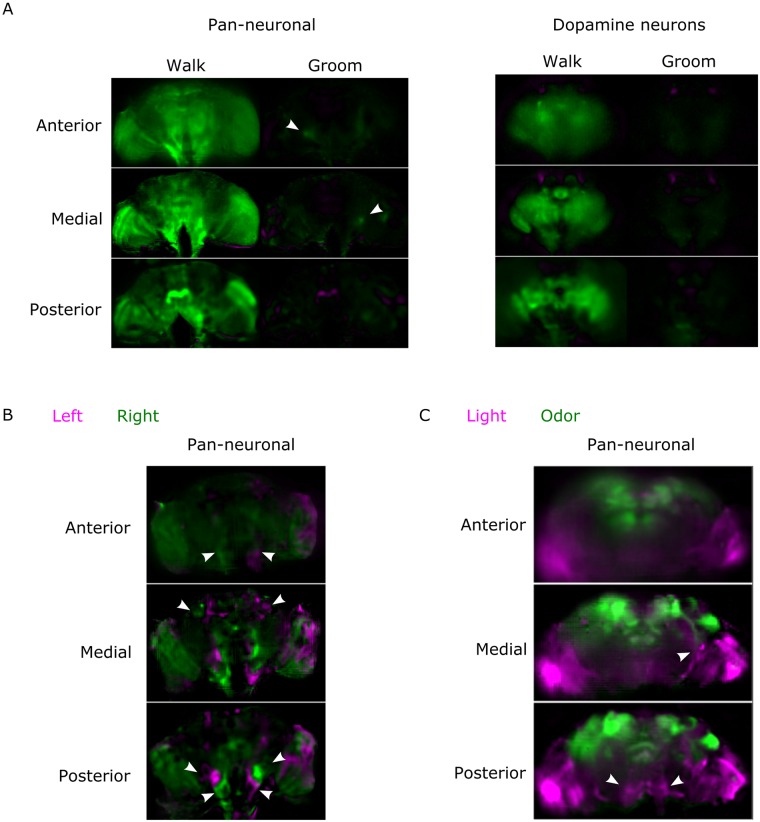
Fig 2. Near-whole brain activity maps for various conditions.
A) Comparison of fluorescence intensity when the fly rests and when it is active (either walking or grooming). The pixel value is green if the fluorescence is higher during the behavior and magenta if the fluorescence is higher during rest. Arrows point to regions (in the antennal mechanosensory and motor center) corresponding to the higher average change between groom and rest among flies (see also S9 Fig). The pan-neuronal driver was nsyb-Gal4 and the dopamine driver was TH-Gal4. Both flies expressed GCaMP6f. Note that there is an angle (39 degrees for the pan-neuronal experiment and 20 degrees for the dopamine experiment) between the z-axis and the anterior—posterior axis. B) Comparison of fluorescence intensity when the fly turns left or right. The arrows point to regions (in the posterior slope, gnathal ganglia, and superior lateral protocerebrum or anterior tubercule) symmetrical and reproducible from fly to fly. The fly’s genotype was nsyb-Gal4 and UAS-GCaMP6f. Note that there is a 40 degree angle between the z-axis and the anterior—posterior axis. The pixel value is green if the fluorescence is higher during turning left, magenta if the fluorescence is higher during turning right. C) Comparison of fluorescence increase during the response to stimuli for odor (magenta) and light (green). The arrows point to the posterior slope (bottom panel) and the optical glomeruli (middle panel). The fly’s genotype was Cha-Gal4, GMR57C10-Gal4, and UAS-GCaMP6f. Note that the brain is tilted 19 degrees along the lateral axis. See also S4–S9 Figs. Data can be found on CNCRS.org (http://dx.doi.org/10.6080/K01J97ZN). CNCRS, Collaborative Research in Computational Neuroscience; nsyb-Gal4, nSynaptobrevin-Gal4; TH-Gal4, tyrosine hydroxylase-Gal4; Cha-Gal4, choline acetyltransferase-Gal4.

