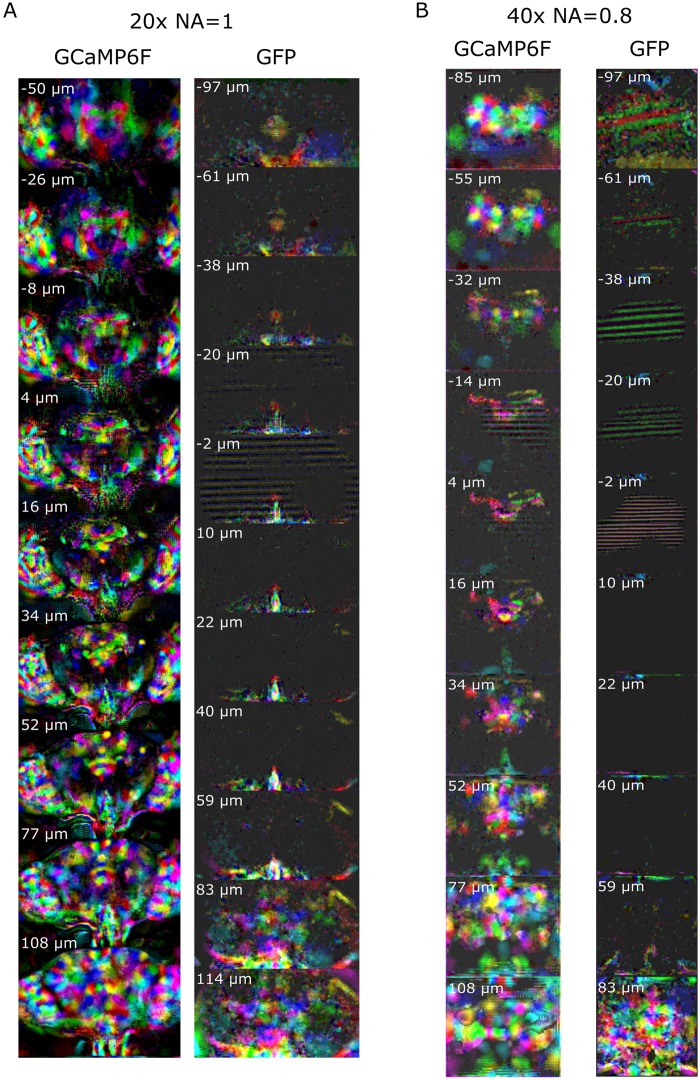
Fig 3. Z-stack slices of the 3D map for all the components extracted using PCA/ICA.
The maps from calcium activity (GCaMP6f) are compared with the maps obtained with an activity-independent fluorophore (GFP). Different colors are assigned randomly to different components. Note that the slice depth is larger when it is farther from the middle of the brain (see Methods section). See S10 and S11 Figs for maps aligned to an anatomical template and S12 Fig for examples of individual artifactual components. GCaMP6f data can be found on CNCRS.org (http://dx.doi.org/10.6080/K01J97ZN). CNCRS, Collaborative Research in Computational Neuroscience; GFP, green fluorescent protein; ICA, independent component analysis; PCA, principal component analysis.

