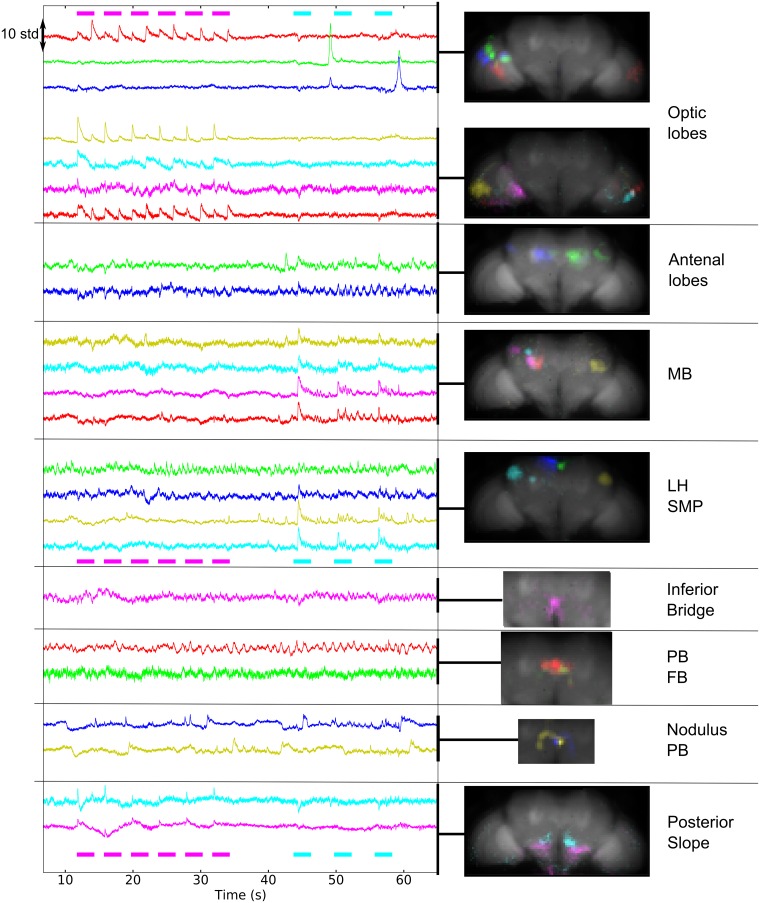
Fig 7. Components extracted from voltage activity.
ArcLight was expressed pan-neuronally (nsyb-Gal4). The fly was presented with periodic flashes of UV light (violet bars) and puffs of apple cider vinegar (pink bars). The component time series are shown on the left (variance normalized), and the corresponding maps are on the right, sorted by the brain region that was majorly present in the map. Note that the coronal plane was tilted 37 degrees away from the horizontal plane for this fly. See also S20–S23 and S25 Figs. Data can be found on CNCRS.org (http://dx.doi.org/10.6080/K01J97ZN). CNCRS, Collaborative Research in Computational Neuroscience; FB, fan-shaped body; LH, lateral horn; MB, mushroom body, nsyb-Gal4, nSynaptobrevin-Gal4; PB, protocerebral bridge; SMP, superior medial protocerebrum.

