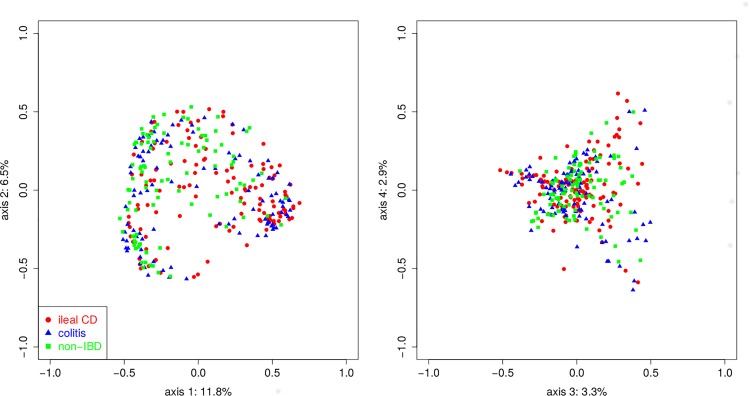
Fig 3. Principal coordinate analysis (PCoA) conducted on genus-level microbiome data using a dissimilarity matrix of Bray Curtis scores.
The IBD phenotypes are color coded as follows: ileal CD (designated by red circle), colitis without ileal disease (designated by red triangle), non-IBD (designated by green square). The four largest dimensions (PC1, PC2, PC3, PC4) are shown and account for 11.8%, 6.5%, 3.3% and 2.9% of the differences, respectively.

