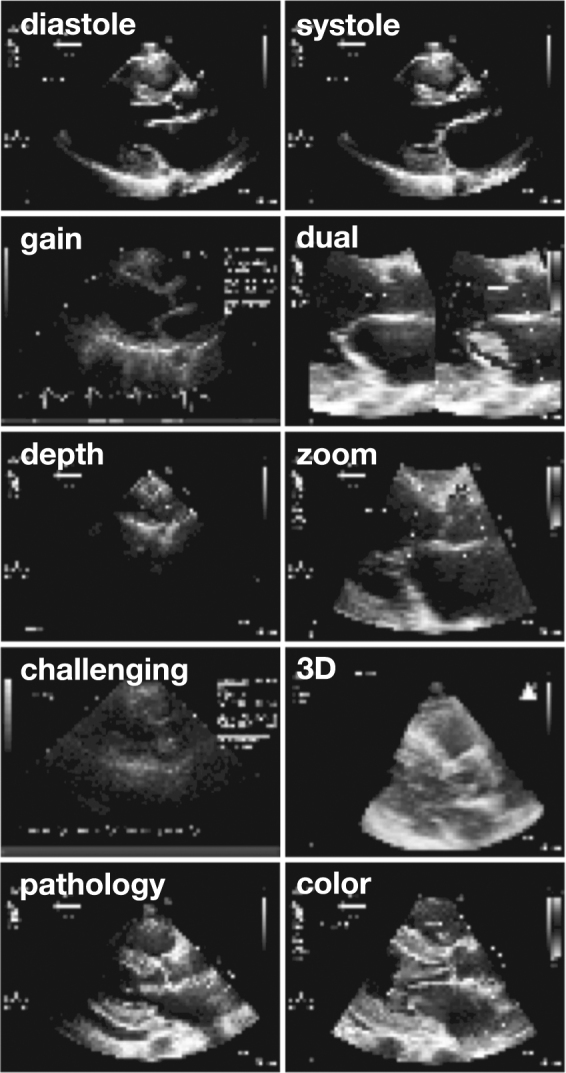
Fig. 3.

Natural variations in input data. In addition to applying data augmentation algorithms, we included in each category a range of images representing the natural variation seen in real-life echocardiography. The parasternal long-axis view is shown here for example. Variations include a range of timepoints spanning diastole and systole, differences in gain or chroma map, use of dual-mode acquisition, differences in depth and zoom, technically challenging images, use of 3D acquisition, a range of pathologies (seen here, concentric left ventricular hypertrophy and pericardial effusion), and use of color Doppler, as well as differences in angulation, sector width, and use of LV contrast. Note that these images are the actual resolution of input data to the deep learning algorithm
