Fig. 5.
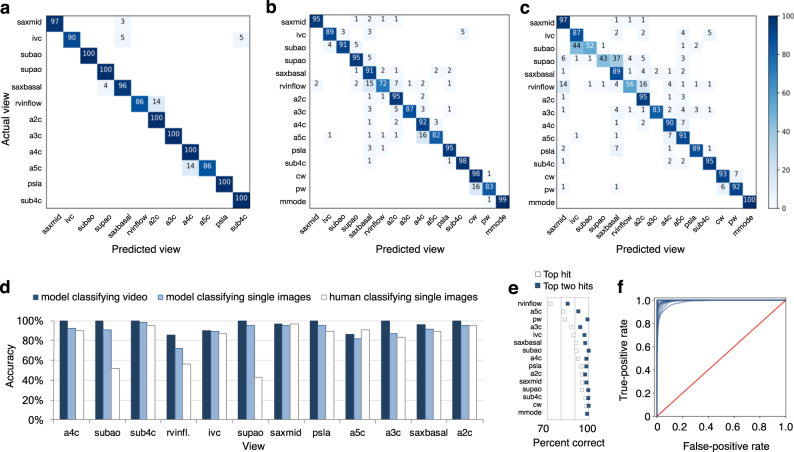
Echocardiogram view classification by deep-learning model. Confusional matrices showing actual view labels on y-axis, and neural network-predicted view labels on the x-axis by view category for video classification (a) and still-image classification (b) compared with a representative board-certified echocardiographer (c). Reading across true-label rows, the numbers in the boxes represent the percentage of labels predicted for each category. Color intensity corresponds to percentage, see heatmap on far right; the white background indicates zero percent. Categories are clustered according to areas of the most confusion. Rows may not add up to 100 percent due to rounding. d Comparison of accuracy by view category for deep-learning-assisted video classification, still-image classification, and still-image classification by a representative echocardiographer. e A comparison of percent of images correctly predicted by view category, when considering the model’s highest-probability top hit (white boxes) vs. its top two hits (blue boxes). f Receiver operating characteristic curves for view categories were very similar, with AUCs ranging from 0.985 to 1.00 (mean 0.996). Abbreviations: saxmid short axis mid/mitral, ivc subcostal ivc, subao subcostal/abdominal aorta, supao suprasternal aorta/aortic arch, saxbasal short axis basal, rvinflow right ventricular inflow, a2c apical 2 chamber, a3c apical 3 chamber, a4c apical 4 chamber, a5c apical 5 chamber, psla parasternal long axis, sub4c subcostal 4 chamber

