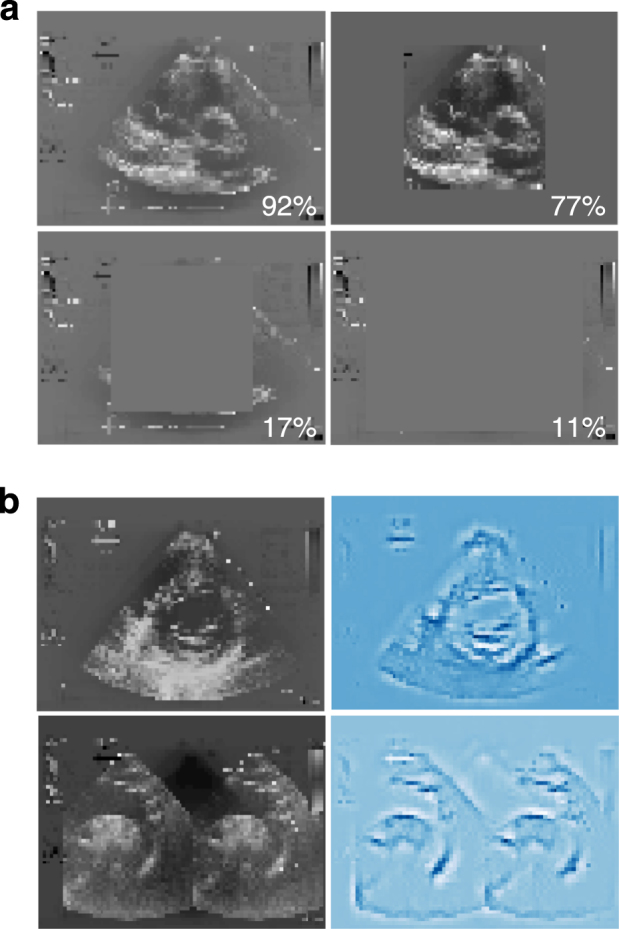
Fig. 6.

Visualization of decision-making by neural network. a Occlusion experiments. All test images (a short axis basal sample image is shown here) were modified with grey masking of different shapes and sizes as shown, and test accuracy predicted for the test set based on each different modification. Masking that covered cardiac structures resulted in the poorest predictions. b Saliency maps. The input pixels weighted most heavily in the neural network’s classification decision for two example images (left; suprasternal aorta/aortic arch and short axis mid/mitral input examples shown) were calculated and plotted. The most important pixels (right) make an outline of structures clinically relevant to the view shown
