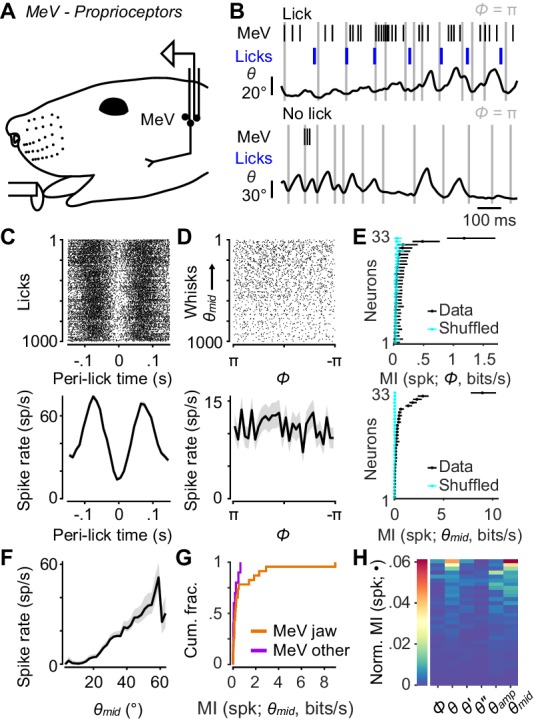
Figure 5. Responses of proprioceptors in the trigeminal mesencephalic nucleus (MeV) during licking and whisking.

(A) Schematic of MeV tetrode recordings during licking and whisking. (B) Example traces for an MeV unit showing spike times (black ticks) and lick times (blue ticks) aligned with position (θ) of a tracked whisker, for one second periods with (top) and without (bottom) licks. (C) Top, spike raster aligned to lick times (n = 1000 random licks) for example unit in (B). Bottom, peri-event time histogram (± SEM) aligned to lick times across all licks. (D) Top, spike raster aligned to whisk cycles (n = 1000 random whisks) for unit in (B). Whisks are ordered by mean θmid. Bottom, phase tuning curve for same unit (mean ± SEM) across all whisk cycles. (E) Top, MI rate between spike count and Φ for each unit (± 95% bootstrap CI). Cyan: results of same calculation but after randomly shuffling spike counts with respect to phase. Bottom, same as top but for MI rate between spike count and θmid. (F) Midpoint tuning curve (mean ± SEM) for unit in (B). (G) Cumulative histograms of MI rate between spike count and θmid for whisking-sensitive MeV units, separately for those that showed modulation by licking or passive jaw movement (orange, n = 23), and others recorded on the same tetrode (purple, n = 10). (H) Heatmap of normalized mutual information for all whisking-sensitive MeV units (n = 33). Conventions as in Figure 2E. Data for panel E are given in Figure 5—source data 1. Data for panel G are given in Figure 5—source data 2. Data for panel H are given in Figure 5—source data 3.
