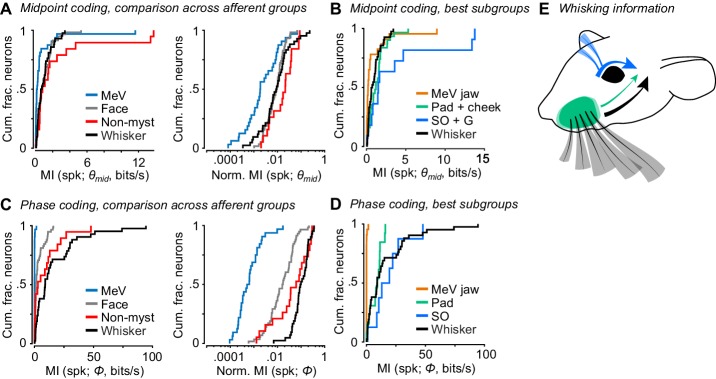
Figure 6. Coding of self-motion by diverse classes of facial mechanoreceptors.
(A) Left, summary cumulative histograms of MI rate between spike count and θmid for whisking-sensitive MeV (n = 33), face (n = 58), non-mystacial vibrissae (n = 19), and whisker units (n = 42). Right, summary histograms of normalized MI between spike count and θmid for same units. (B) Summary histograms of MI rate between spike count and θmid for the best encoding subgroups of whisking-sensitive units: putative jaw proprioceptors in MeV (n = 23), pad and cheek units (n = 31), supraorbital and genal units (n = 11), and whisker units (replotted from A). (C) Left, same as (A) but for MI rate between spike count and Φ. (D) Same as (B) but for the subgroups that best encoded Φ: putative proprioceptors in MeV (n = 23), pad units (n = 13), supraorbital units (n = 8), and whisker units (replotted from C). (E) Schematic depicting flow of information about whisking kinematics from various peripheral mechanoreceptors to the brain: whisker follicle (black), supraorbital vibrissa (blue), and whisker pad hairy skin (green) afferents. (B–D) Panels include data from Figures 2–5 plotted together for comparison. Data for panels A and C are given in Figure 6—source data 1. Data for panel B are given in Figure 6—source data 2. Data for panel D are given in Figure 6—source data 3.


