. 2019 Jan 29;8:e41540. doi: 10.7554/eLife.41540

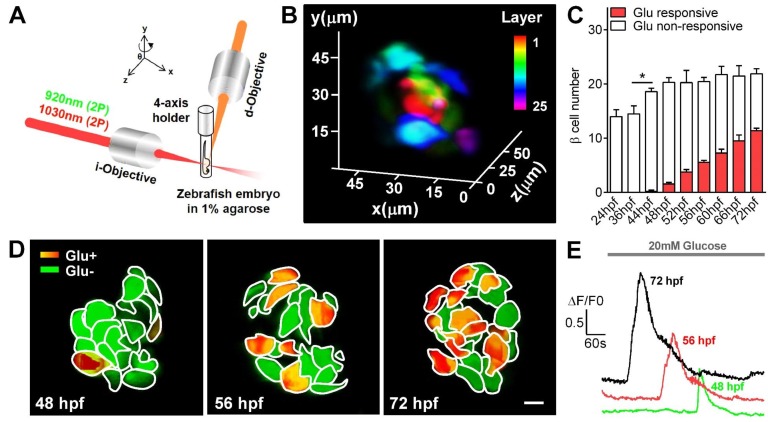
Figure 1. Visualization and characterization of β-cell functional development in vivo using 2P3A-DSLM.

(A) An abbreviated scheme of the dual-color 2P3A-DSLM imaging system. (B) 3D-projection of all pancreatic β-cells in a live Tg (ins:Rcamp1.07) zebrafish embryo at 72 hpf. The different colors in the color bar represent different depths in the islet. (C) Quantification of glucose-responsive and glucose-nonresponsive β-cells at different stages from 24 to 72 hpf in live Tg (ins:Rcamp1.07);Tg (ins:EGFP) embryos. n = 10–16 embryos per stage. *p<0.05. (D) An illustration of the glucose-responsive (red) and glucose-nonresponsive (green) β-cells in islets in live Tg (ins:Rcamp1.07) embryos at 48, 56 and 72 hpf. (E) Representative traces of glucose-triggered maximum Ca2+ transients at the indicated stages. Scale bar: 10 μm. See also Figure 1—figure supplements 14 and Videos 13.

Figure 1.

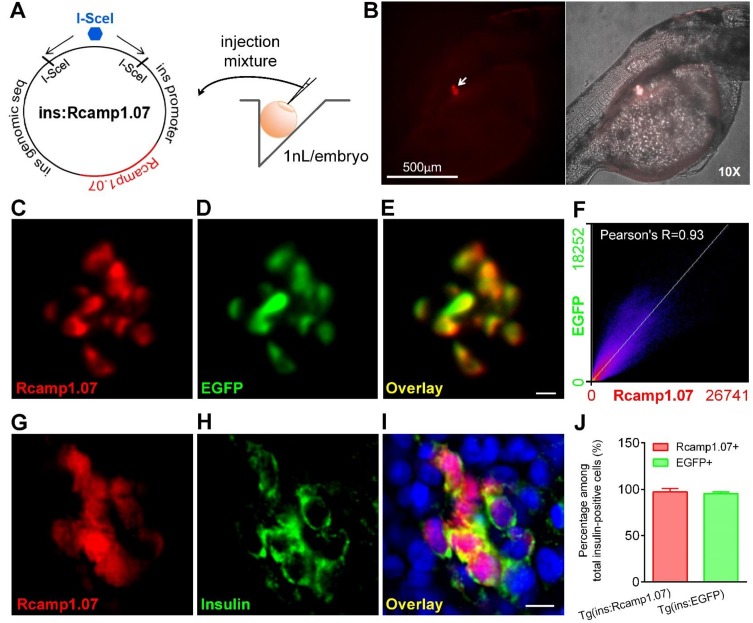
Figure 1—figure supplement 1. Rcamp1.07 was specifically expressed in pancreatic β-cells in Tg (ins:Rcamp1.07) zebrafish.

Figure 1—figure supplement 1.

(A) An illustration showing the protocol for generating the Tg (ins:Rcamp1.07) zebrafish line. (B) Rcamp1.07 fluorescent signals were specifically localized in the islet region in Tg (ins:Rcamp1.07) zebrafish under a fluorescence stereomicroscope. (C–E) Representative dual-color 2P3A-DSLM images of Rcamp1.07 (C), EGFP (D) and the merged image (E) of the islet β-cells in a live Tg (ins:Rcamp1.07);Tg (ins:EGFP) embryo at 72 hpf. (F) Co-localization of Rcamp1.07 and EGFP was analyzed using Mander’s intensity correlation (Fiji), and Pearson’s R value was 0.93. (G–I) Representative confocal images of immunofluorescent staining for Rcamp1.07 (G), insulin (H) and DAPI (blue) in the merged image (I) of the islet cells in Tg (ins:Rcamp1.07) embryos at 72 hpf. (J) Percentages of Rcamp1.07-positive and EGFP-positive cells among total insulin-positive cells in Tg (ins:Rcamp1.07) and Tg (ins:EGFP) embryos. n = 8 embryos per condition. Scale bars: 10 μm; scale bars apply to C–E and G–I.
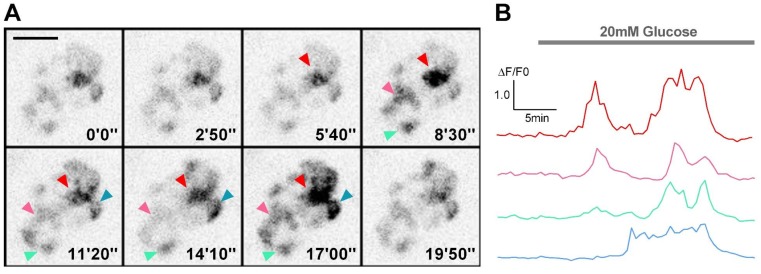
Figure 1—figure supplement 2. Visualization of glucose-stimulated calcium transients in β-cells in live Tg (ins:Rcamp1.07) embryos under a spinning-disc confocal microscope.

Figure 1—figure supplement 2.

(A) Representative images of Rcamp1.07-indicated calcium transients in β-cells in a live Tg (ins:Rcamp1.07) embryo at 72 hpf before and after 20 mM glucose stimulation. At the 5 min time point, 20 mM glucose was added. Arrowheads indicate four representative regions within the islet. (B) Time courses of the calcium transients in the regions marked in (A). Scale bars: 20 μm.
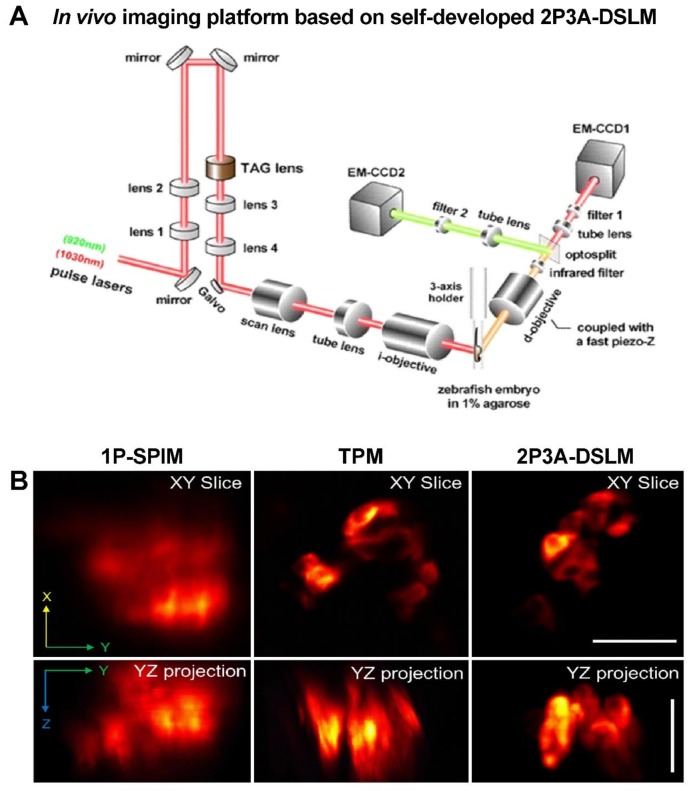
Figure 1—figure supplement 3. Reconstruction of a clear 3D structure of the islet in live zebrafish embryos with our 2P3A-DSLM setup.

Figure 1—figure supplement 3.

(A) A detailed scheme of the in vivo imaging platform based on our self-developed dual-color 2P3A-DSLM. (B) Comparison of image qualities among single-photon selective-plane illuminative microscope (1P-SPIM), two-photon microscope (TPM) and 2P3A-DSLM. Scale bars: 20 μm. See also Video 1.
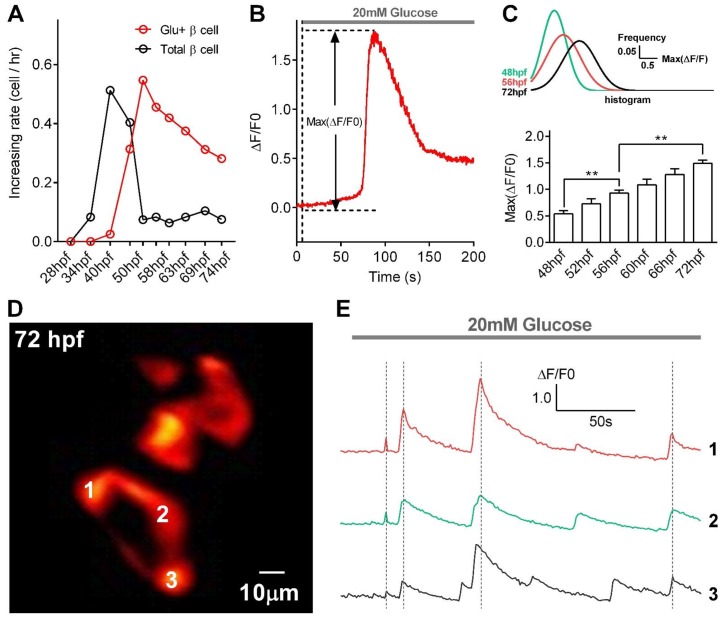
Figure 1—figure supplement 4. Quantification of glucose-responsive β-cells, evaluation of their functional states, and observation of glucose-induced synchronized calcium transients in β-cells in live Tg (ins:Rcamp1.07) embryos under 2P3A-DSLM.

Figure 1—figure supplement 4.

(A) Increases in the numbers of total β-cells and glucose-responsive β-cells at different stages from 28 to 74 hpf. n = 10–16 embryos per stage. (B) An illustration of the maximum amplitude (Max ΔF/F0), a parameter describing the kinetics of glucose-stimulated Ca2+ transients. (C) The maximum amplitudes of Ca2+ transients in glucose-responsive β-cells from 48 to 72 hpf. The top inset shows histograms of the maximal amplitudes of Ca2+ transients from β-cells in 48 hpf, 56 hpf and 72 hpf zebrafish by Gaussian fitting. n = 10–16 embryos per stage. **p<0.01. (D) Representative images of Rcamp1.07 in β-cells in a live Tg (ins:Rcamp1.07) embryo at 72 hpf after 20 mM glucose stimulation. Numbers indicate three neighboring β-cells with synchronized calcium transients. (E) Time courses of glucose-induced synchronized calcium transients in the β-cells marked in (D). See also Video 2.