. 2019 Jan 29;8:e41540. doi: 10.7554/eLife.41540

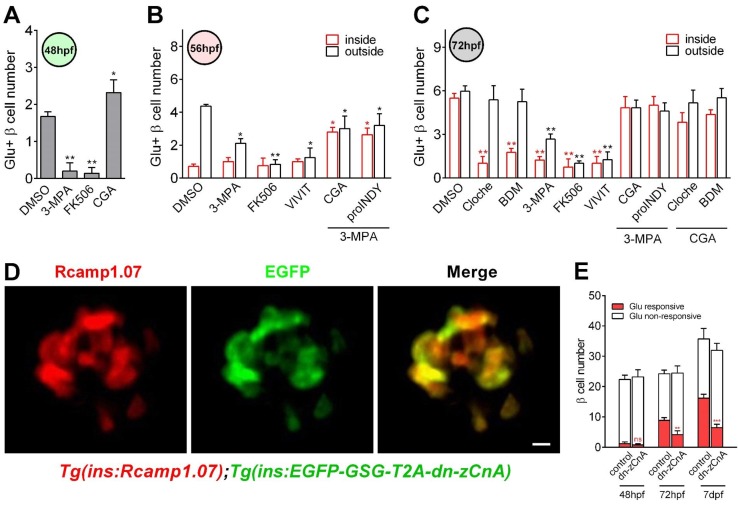
Figure 4. Calcineurin/NFAT signaling acted as the downstream of glucose to initiate and enhance β-cell functionality.

(A) Numbers of glucose-responsive β-cells in 48 hpf embryos that had been treated with the indicated reagents. n = 4–8 embryos per condition. *p<0.05, **p<0.01. (B) Numbers of glucose-responsive β-cells in the mantle and the core of the islet in 56 hpf embryos that had been treated with the indicated reagents. n = 5–9 embryos per condition. *p<0.05, **p<0.01. (C) Numbers of glucose-responsive β-cells in the mantle and the core of the islet in 72 hpf embryos that had been treated with the indicated reagents. n = 5–9 embryos per condition. **p<0.01. (D) Representative two-photon images of Rcamp1.07 (left), EGFP (middle) and the merged image (right) of the islet cells in a living Tg (ins:Rcamp1.07);Tg (ins:EGFP-GSG-T2A-dn-zCnA) embryo. (E) Numbers of glucose-responsive β-cells in age-matched controls and dn-zCnA-expressing embryos at 48 hpf, 72 hpf and seven dpf. n = 4–6 embryos per stage. **p<0.01, ***p<0.001; ns, not significant. Scale bar: 10 μm. See also Figure 4—figure supplements 12 and Videos 56.

Figure 4.

Figure 4—figure supplement 1. Glucose activated calcineurin/NFAT to enhance and sustain the functionality of β-cells during the late hatching period.

Figure 4—figure supplement 1.

(A) The maximum amplitudes of glucose-responsive β-cells in 48 hpf embryos that had been treated with the indicated reagents. n = 4–8 embryos per condition. *p<0.05; ns, not significant. (B) The maximum amplitudes of glucose-responsive β-cells in the mantle and the core of the islet in 56 hpf embryos that had been treated with the indicated reagents. n = 5–9 embryos per condition. *p<0.05. (C) The maximum amplitudes of glucose-responsive β-cells in the mantle and the core of the islet in 72 hpf embryos that had been treated with the indicated reagents. n = 5–9 embryos per condition. *p<0.05, **p<0.01.
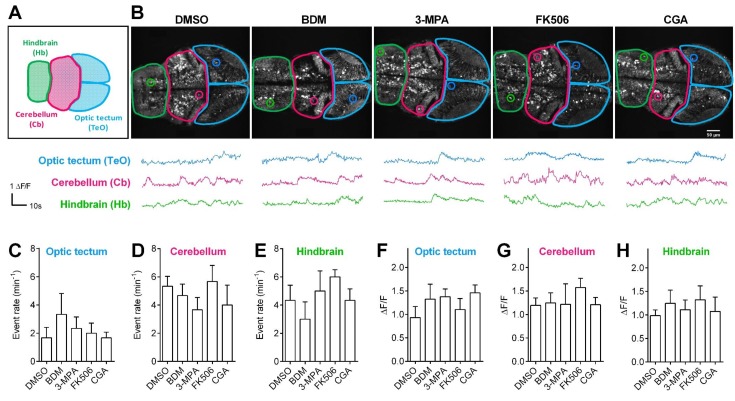
Figure 4—figure supplement 2. Pharmacological treatments did not affect calcium activities of CNS neurons in living Tg (elavl3:Gcamp6s) zebrafish embryos.

Figure 4—figure supplement 2.

(A) The schematic illustrates three different brain regions in zebrafish embryos. (B) Representative 72 hpf Tg (elavl3:Gcamp6s) embryos (top) and time courses of calcium transients (bottom) from individual neurons in living embryos that had been treated with the indicated pharmacological reagents. (C–E) Quantification of event rate of calcium transients from neurons in living 72 hpf Tg (elavl3:Gcamp6s) embryos that had been treated with the indicated pharmacological reagents used in this study. 10–20 neurons were randomly selected in the indicated three brain regions from three embryos per condition. (F–H) Average amplitudes of calcium transients from neurons in living 72 hpf Tg (elavl3:Gcamp6s) embryos that had been treated with the indicated pharmacological reagents used in this study. 10–20 neurons were randomly selected in the indicated three brain regions from three embryos per condition.