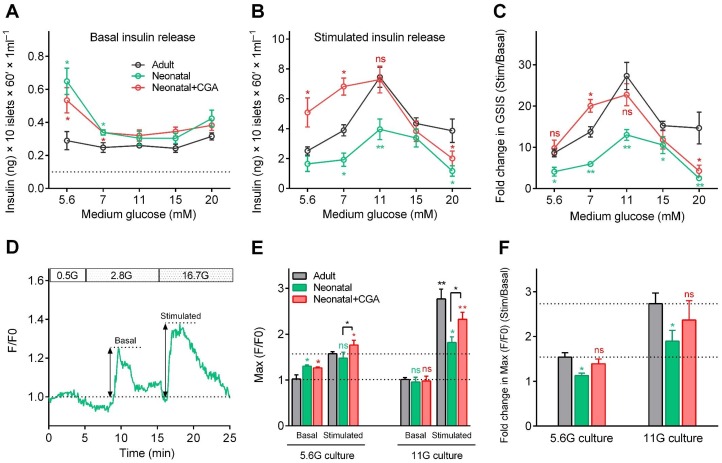
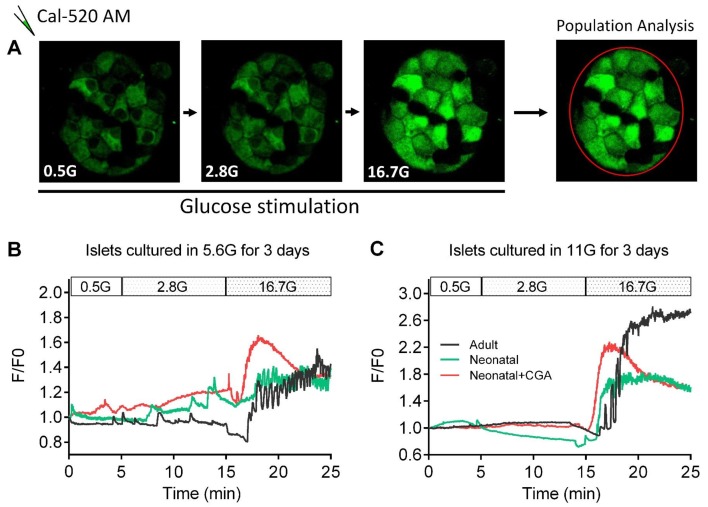
Figure 5. Direct activation of calcineurin promoted the optimal maturity of neonatal mouse β-cells in isolated islets in vitro.
(A–B) Glucose-induced insulin secretion from neonatal and adult mouse islets sequentially stimulated with 3 mM glucose (A) and 20 mM glucose (B) after isolation from P0 and 8-week-old mice, and for 3 days of culture in different types of media (different concentrations of glucose combined with or without CGA) in vitro. The black dotted line in A indicates the value of the ELISA kit detection limit. n = 4–10 experiments per condition. *p<0.05, **p<0.01; ns, not significant. (C) Glucose Stimulation Index (fold change in GSIS) of the mouse islets described in (A) and B). n = 4–10 experiments per condition. *p<0.05, **p<0.01; ns, not significant. (D) An illustration of the maximum amplitude of calcium influx in islets under 2.8 mM and 16.7 mM glucose stimulation. (E) Quantification of maximal amplitude of glucose-induced calcium influx in islets under different culture conditions. n = 4–7 islets per condition. *p<0.05, **p<0.01; ns, not significant. (F) Fold change in maximal amplitude of glucose-induced calcium influx in islets under stimulation and resting conditions described in (E). n = 4–7 islets per condition. *p<0.05; ns, not significant. See also Figure 5—figure supplement 1.


