Figure 1.

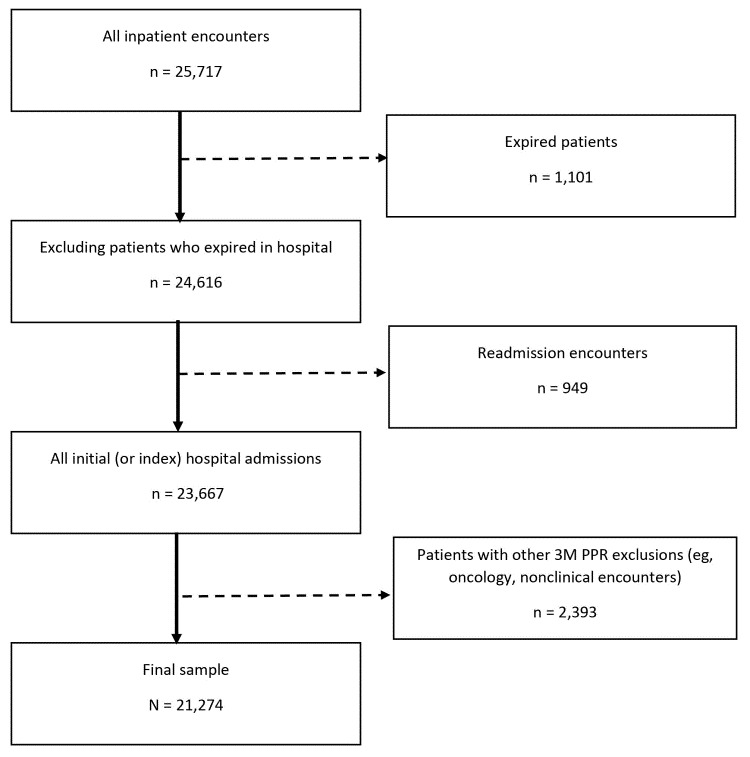
Selection criteria for the predictive model for all inpatient encounters (N = 25,717) collected from 2 urban hospitals in Hawai’i. Abbreviation: PPR, potentially preventable readmission.

Selection criteria for the predictive model for all inpatient encounters (N = 25,717) collected from 2 urban hospitals in Hawai’i. Abbreviation: PPR, potentially preventable readmission.