Fig. 8.

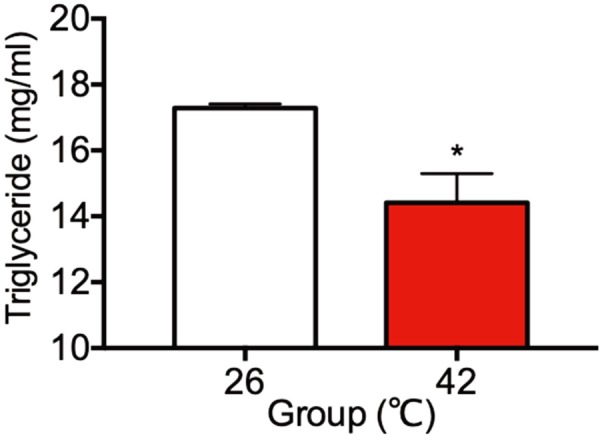
Plasma concentrations of triglyceride in the 26°C control rats and the 42°C heat treated rats at 30 day of age. Each bar represents mean ± S.E.M. of 4 rats. Asterisks indicate significant difference compared to the control (*P<0.05).

Plasma concentrations of triglyceride in the 26°C control rats and the 42°C heat treated rats at 30 day of age. Each bar represents mean ± S.E.M. of 4 rats. Asterisks indicate significant difference compared to the control (*P<0.05).