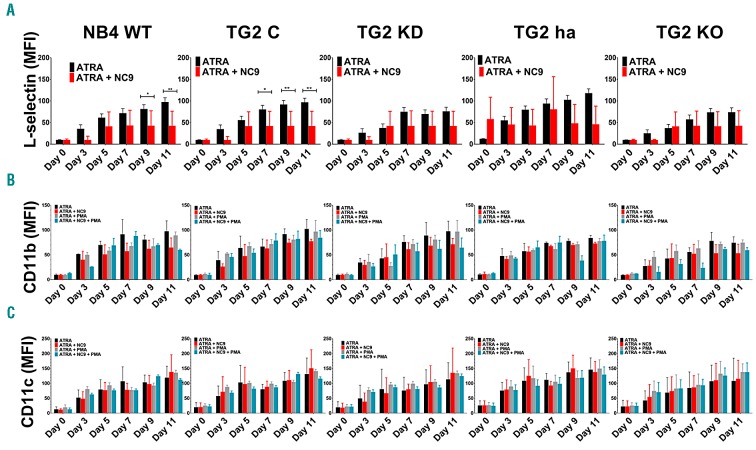
Figure 2.
All-trans retinoic acid (ATRA) induces both CD11b and CD11c β2 integrin expression and their high-affinity state on the cell surface of NB4 cell lines. FACS analysis of (A) cell-surface expression of L-selectin, differentiation marker (B) CD11b and (C) CD11c in 1 μM ATRA, 1 μM ATRA + 30 μM NC9, or after 20 minutes stimulation of 10 nM PMA-treated NB4-WT, TG2-C, NB4 TG2-KD, TG2-ha, and TG2-KO cells, respectively, at the indicated days. Measurements were conducted in triplicates, and values were validated via Flowing software. Graphs show the representation of the mean±Standard Deviation fluorescent intensity (MFI) values, in parallel. MFI values were calculated based on each treatment’s respective isotype control (n=9). Statistical analysis was performed via two-way analysis of variance (ANOVA; Bonferroni post-hoc test; *P<0.05, **P<0.01, ***P<0.005 ****P<0.001).

