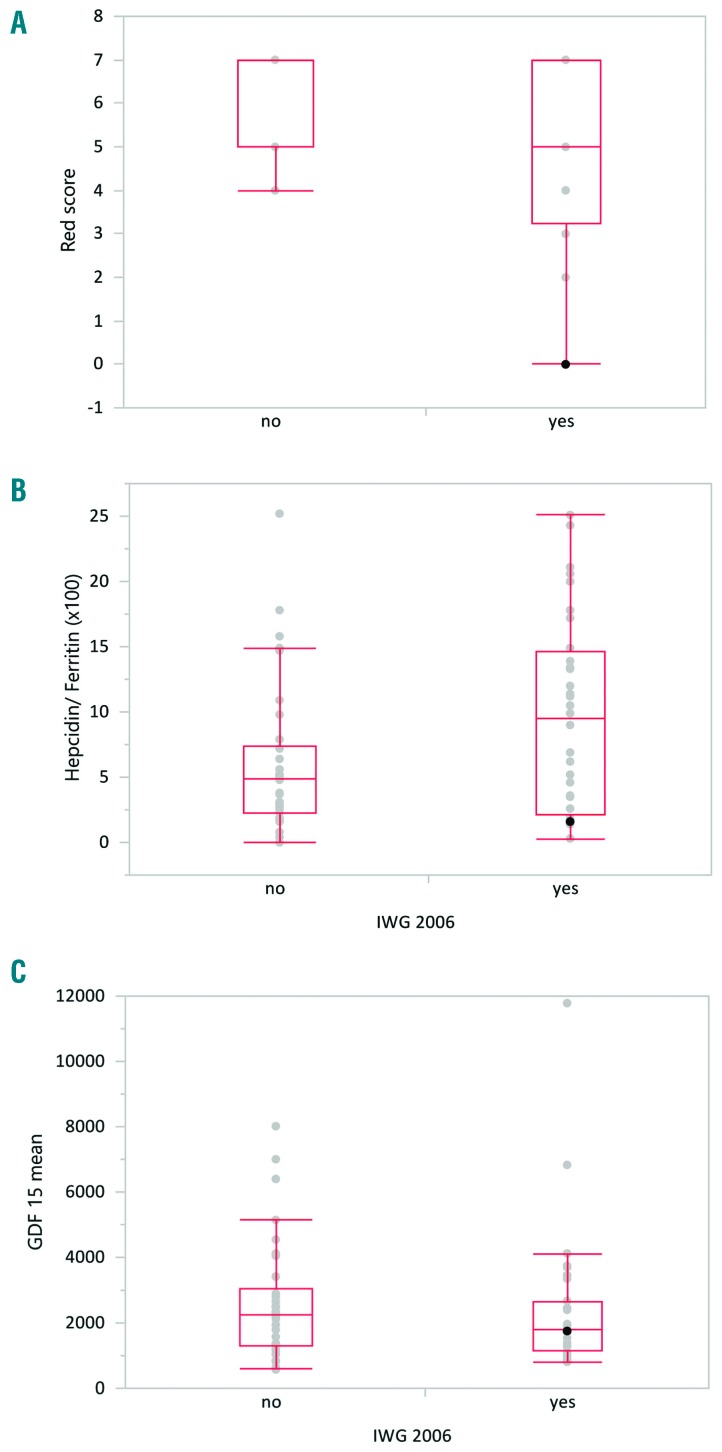
Figure 1.
Biological markers of dyserythropoiesis and correlation with response to erythropoiesis-stimulating agents. Response was defined according to the International Working Group 2006 criteria (IWG 2006) for hematologic improvement-erythroid. (A) Mean RED score before treatment for patients who did have a response (yes) or did not have a response (no). Non-responders had higher RED scores (P=0.01). (B) Mean hepcidin:ferritin ratio in patients who did or did not have a response; the hepcidin:ferritin ratio was lower in non-responders (P=0.04). (C) Mean GDF-15 level in patients who did or did not respond to erythropoietin-stimulating agent treatment (P=0.4).

