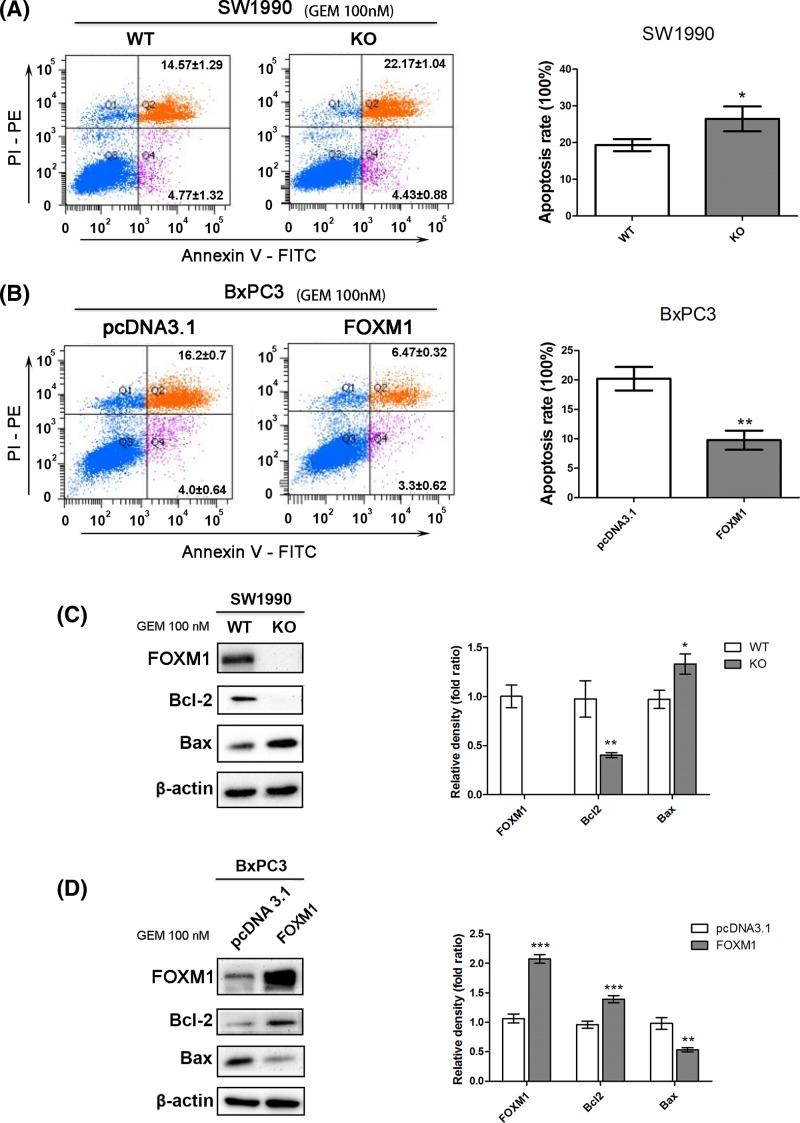
Figure 4. FOXM1 reduced apoptosis induced by gemcitabine.
(A,B) After treatment with 100 nM gemcitabine for 24 h, the apoptosis rates of SW1990-WT, SW1990-FK, BxPC3-pcDNA3.1, and BxPC3-FOXM1 cells were calculated using flow cytometric determination of Annexin V and PI staining. Upper-right + lower-right quadrants indicate apoptotic cells. Apoptosis is quantitated in the bar graphs for SW1990-WT and SW1990-FK (top) and BxPC3-pcDNA3.1 and BxPC3-FOXM1 (bottom). (C,D) Changes in the levels of apoptosis proteins, including Bcl-2 and Bax, were tested by Western blotting after FOXM1 knockout or overexpression combined with gemcitabine treatment. *P<0.05; **P<0.01; ***P<0.001.

