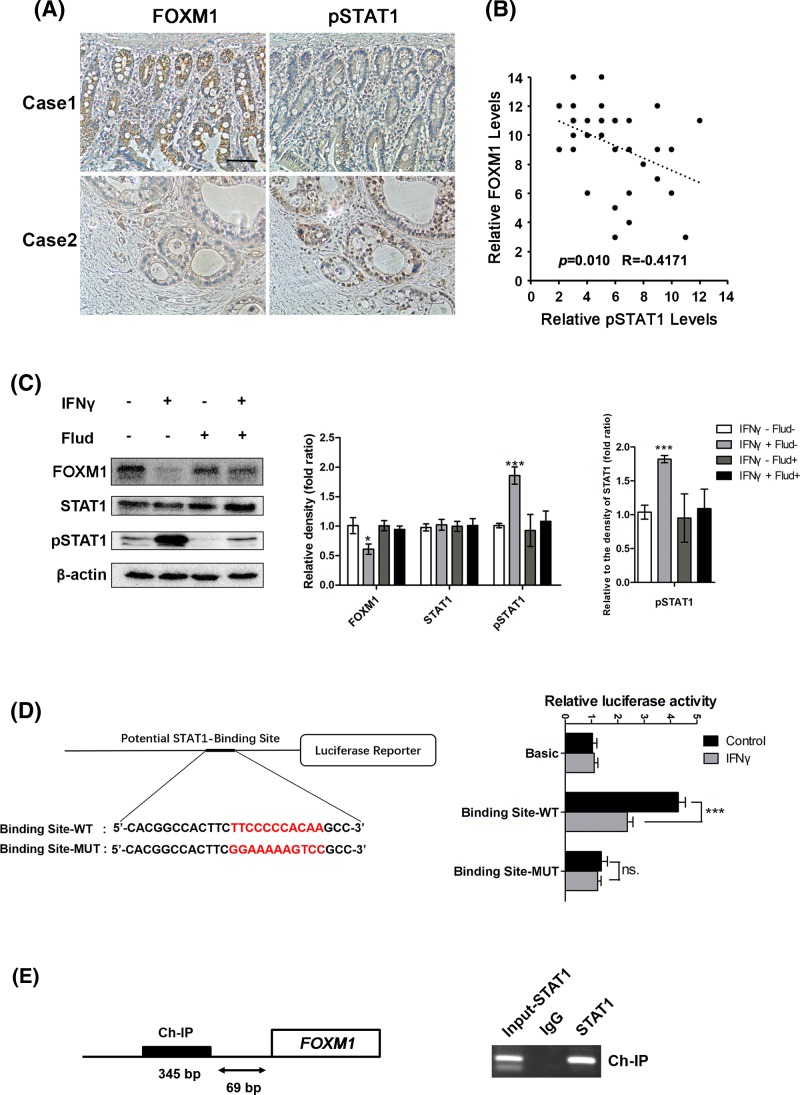
Figure 6. STAT1 directly suppresses FOXM1 expression in pancreatic cancer cells.
(A) Staining of the same cohorts of pancreatic tumor sections for FOXM1 expression and pSTAT1 level. (B) The negative correlation of FOXM1 expression with the pSTAT1 level, as assessed using Pearson correlation coefficient analysis (n=37, r = −0.417, P<0.05). (C) SW1990 cells were treated with IFNγ (100 ng/ml) and/or Fludarabine (10 μM) for 24 h and then whole cell lysates were extracted. FOXM1, STAT1, and pSTAT1 levels were analyzed using Western blotting. The protein levels in each well were determined quantitatively by densitometry analysis (right panels). The experiments were performed three times. (D) Schematic diagram of the FOXM1 promoter luciferase reporter genes. WT, wild-type FOXM1-Luc reporter; MUT, mutant FOXM1-Luc with pSTAT1-binding sites mutated. Luciferase assays for either the wild-type FOXM1 promoter (Binding Site-WT) or mutant FOXM1 promoter (binding site-MUT) with or without IFNγ in SW1990 cells. Basic, empty vector control. NS, no significant difference. (E) 1000 bp sequence from the FOXM1 promoter from start of transcription (+1), indicating the STAT1 bindings sites (bold boxes). Ch-IP assay demonstrating the direct binding of pSTAT1 to the FOXM1 promoter in SW1990 cells. Abbreviation: Ch-IP, chromatin immunoprecipitation. *P<0.05; ***P<0.001.

