
Figure 3.
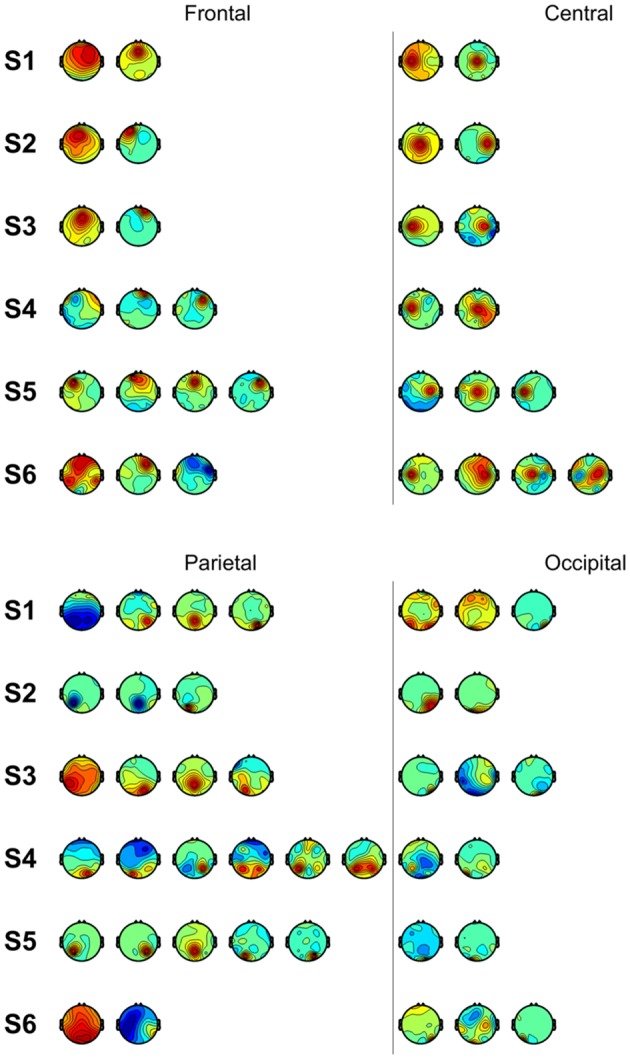
Scalp maps of independent components categorized according to area of peak activity for all subjects.
Official websites use .gov
A
.gov website belongs to an official
government organization in the United States.
Secure .gov websites use HTTPS
A lock (
) or https:// means you've safely
connected to the .gov website. Share sensitive
information only on official, secure websites.
Scalp maps of independent components categorized according to area of peak activity for all subjects.