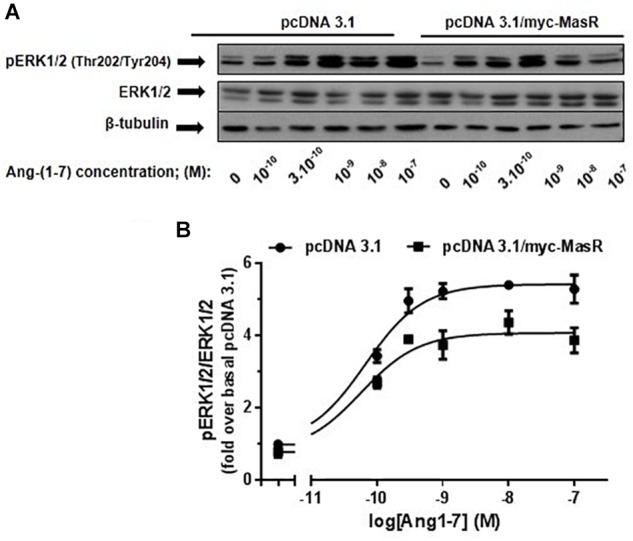
Figure 4.

Dose-response effect of Ang-(1–7) on ERK1/2 phosphorylation levels. HEK293T cells were transfected either with the pcDNA3.1/myc-MasR vector or with the empty vector (pcDNA 3.1), starved in DMEM without serum for 8 h and then incubated for 5 min with increasing concentrations of Ang-(1–7). (A) Phosphorylation levels of ERK1/2 at activating residues Thr202/Tyr204, total ERK1/2 and β-tubulin abundance were determined by Western Blotting. (B) Data quantification. Bands intensity was quantified by optical densitometry, each individual value of pERK was normalized to that of total ERK and expressed as relative to the value obtained after incubation with cells transfected with pcDNA 3.1 and incubated with vehicle (basal value). Data are means ± SEM of three independent experiments. Values were fitted to a sigmoidal dose-response curve. Maximal response best-fitted values were analyzed by extra sum-of-squares F test, significantly different (P < 0.001).
