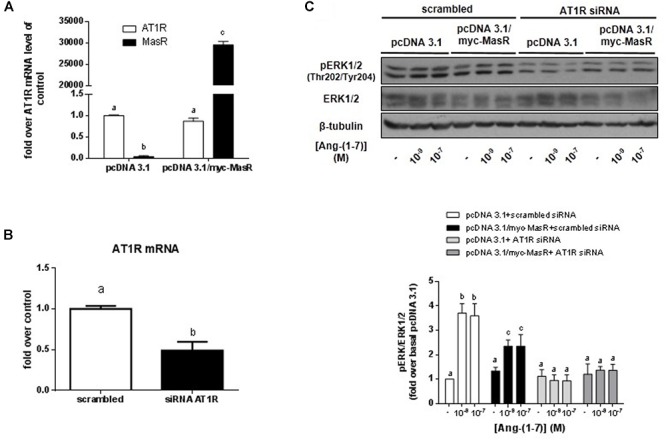
Figure 6.

Participation of the MasR and AT1R in Ang-(1–7) induced ERK phosphorylation. (A) Levels of mRNA coding for AT1R and MasR in HEK293T cells. The levels of mRNA were determined by qPCR in HEK293T cells transfected with pcDNA 3.1 and pcDNA 3.1/myc-MasR vectors as described in Section “Materials and Methods.” Data represent the mean ± SEM of three independent experiments. (B) Levels of mRNA coding for AT1R in cells transfected with AT1R siRNA. HEK293T cells were transfected with scrambled siRNA or AT1R siRNA and after 48 h the mRNA levels coding for AT1R were determined by qPCR as described in Section “Materials and Methods.” Data represent the mean ± SEM of three independent experiments. (C) Effect of silencing the AT1R on Ang-(1–7)-induced activation of ERK1/2. HEK293T cells that were transfected with the pcDNA3.1/myc-MasR plasmid or with the empty vector (pcDNA 3.1), were incubated for 5 min with Ang-(1–7) at the indicated concentrations. Experiments were performed in AT1R-silenced cells and in control cells (scrambled siRNA). Phosphorylation levels of ERK1/2 at activating Thr202/Tyr204, total ERK1/2 and β-tubulin abundance were determined by Western Blotting. Bands intensities were quantified by optical densitometry, pERK individual values were normalized to total ERK1/2 values and expressed as relative to the value obtained with control cells (transfected with pcDNA 3.1 and scramble siRNA) and incubated with vehicle (basal value). Data are means ± SEM of three independent experiments. Different letters denote significant difference at P < 0.05.
