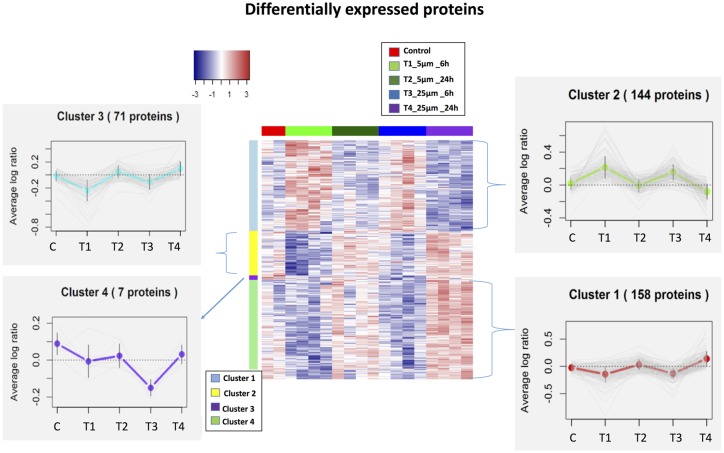
Figure 2.
Heatmaps (hierarchical clustering) of the log-transformed ratios of differentially expressed proteins [differences between all experimental conditions via analysis of variance (ANOVA)] after Amyloid β (Aβ) treatments; row clustering only. Column colors indicate treatment type and the cluster patterns are detailed on the side plots.

