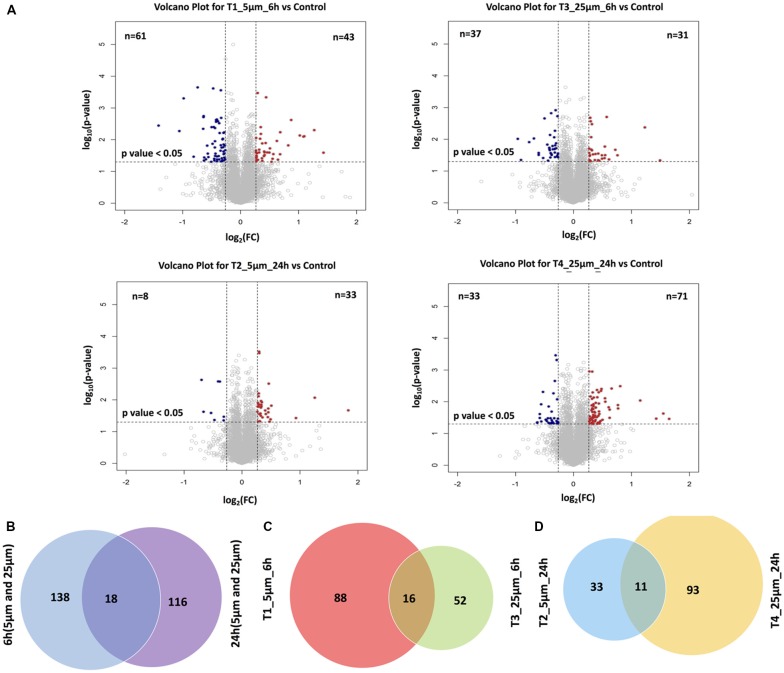
Figure 3.
(A) Volcano plots demonstrating the dual thresholds for differentially regulated proteins. Proteins within the upper and outer quadrants meet both the fold change and p-value cut-off and are therefore considered as differentially regulated. (B) Venn diagram indicating the overlap between the differentially expressed proteins identified and quantified in cells after treated for 6 h and 24 h, respectively (1% FDR). (C) Venn diagram indicating the overlap between the differentially expressed proteins identified and quantified in T1 and T3 (1% FDR). (D) Venn diagram indicating the overlap between the differentially expressed proteins identified and quantified in T2 and T4 (1% FDR).

