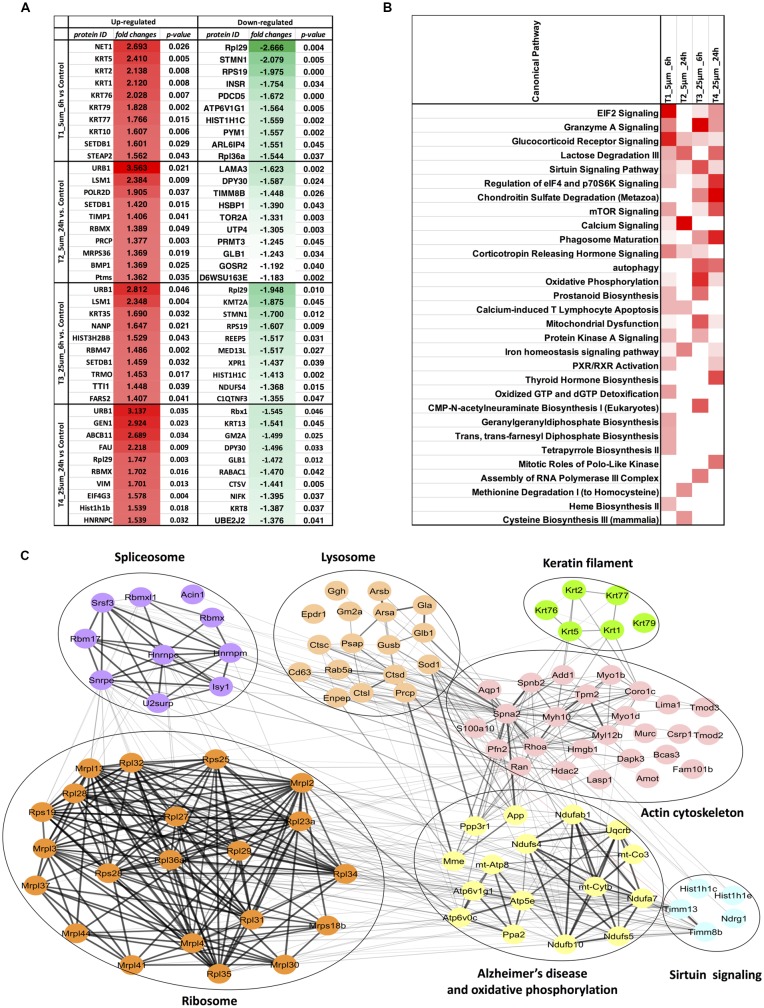
Figure 4.
(A) Top 10 regulated proteins in four treatments. (B) Comparison of the top canonical pathways enriched from ingenuity pathway analysis (IPA) analysis of differentially regulated proteins (treatment vs. control) in four treatments. The significance of functional enrichment is highlighted with red color. (C) Functional interaction networks analyzed by the String Cytoscape plugin. One-hundred and one differentially expressed proteins were in pathways related to Alzheimer’s disease (AD). Network nodes are labeled with gene symbols.

