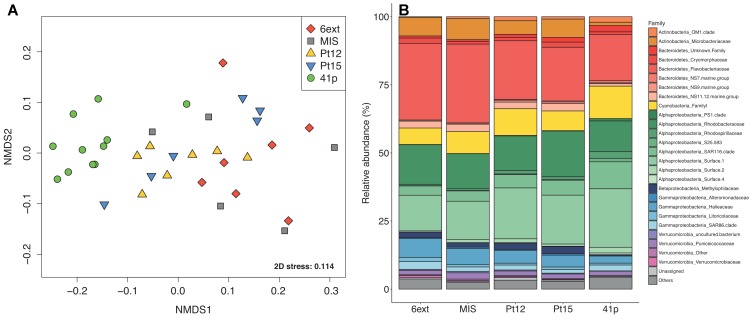
FIGURE 2.
Spatial variations of bacterioplankton community structure. (A) Non-metric dimensional scaling (nMDS) ordination based on Bray–Curtis dissimilarity for 16S rRNA gene libraries between the different sampling sites. Each symbol corresponds to a distinct site, time, and depth point. (B) Bar plot showing the average family-level contribution for each site. Families that on average comprised less than 1% of the libraries are grouped as “Others.” Colors indicate different classes within phyla.

