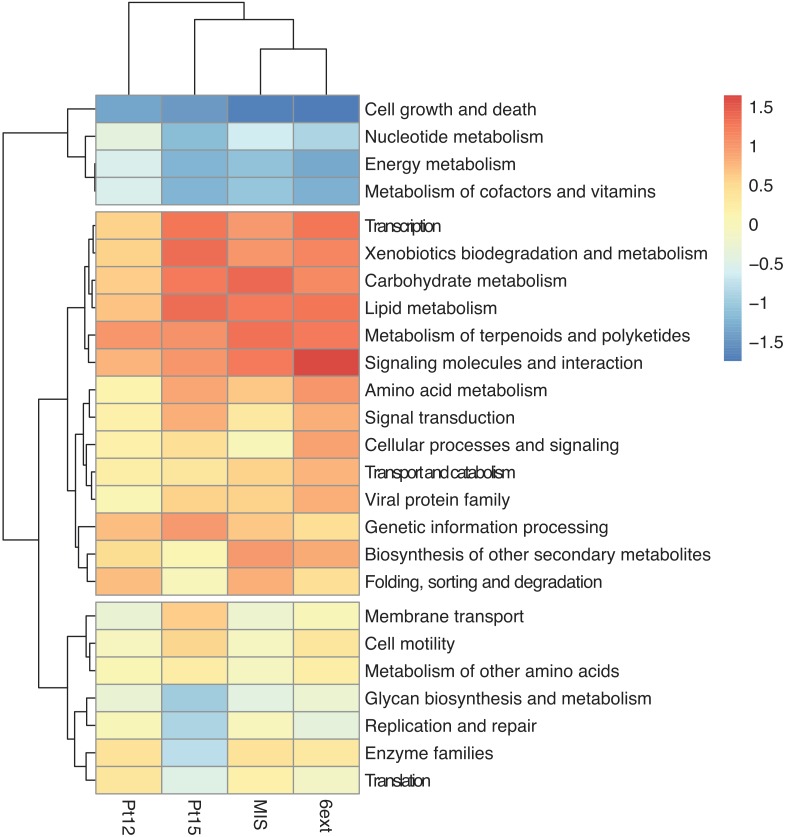
FIGURE 6.
Heatmap based on the main KEGG pathways predicted at the different sampling sites. Frequencies of predicted KEGG categories were normalized with reference to the uncontaminated site 41p. Enrichments correspond to the positive values and red colors, depletions correspond to negative values and blue colors.

