Figure 3.

Effects of chronic exercise on myotonia
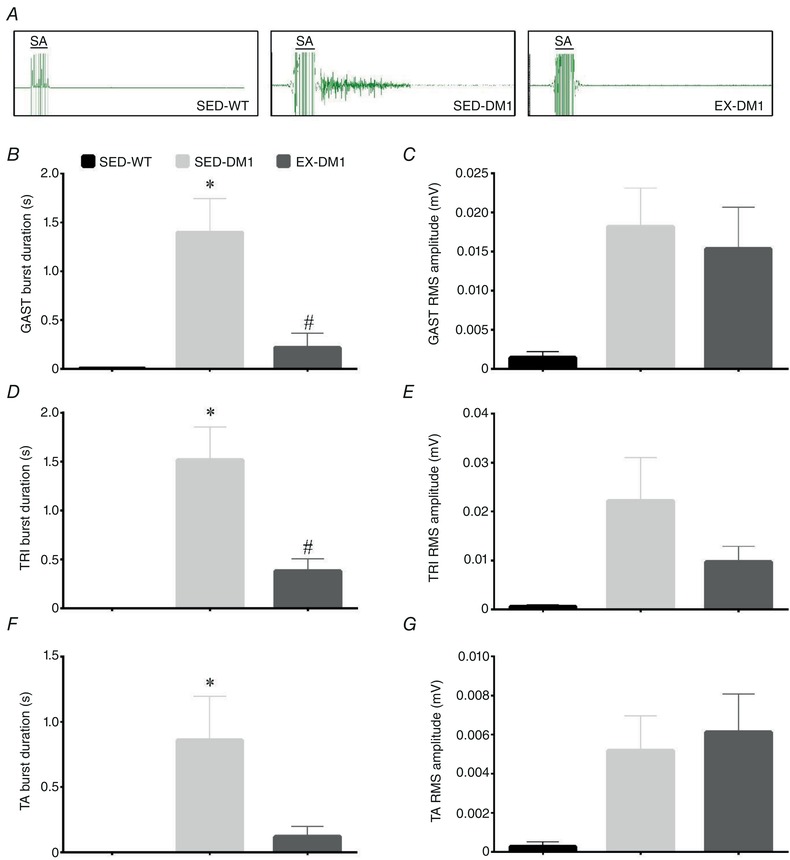
A, representative intramuscular electromyogram (EMG) tracings of gastrocnemius (GAST) muscles in SED‐WT, SED‐DM1 and EX‐DM1 mice. Note the stimulation artifact (SA) for 50 Hz stimulation present at left of each EMG. B–G, graphical summaries of the burst duration and root mean squared (RMS) amplitude of a 1 s stimulation in the GAST (B and C), triceps (TRI; D and E), and tibialis anterior (TA) muscles (F and G). n = 6–11; * P < 0.05 vs. SED‐WT; # P < 0.05 vs. SED‐DM1. [Color figure can be viewed at wileyonlinelibrary.com]
