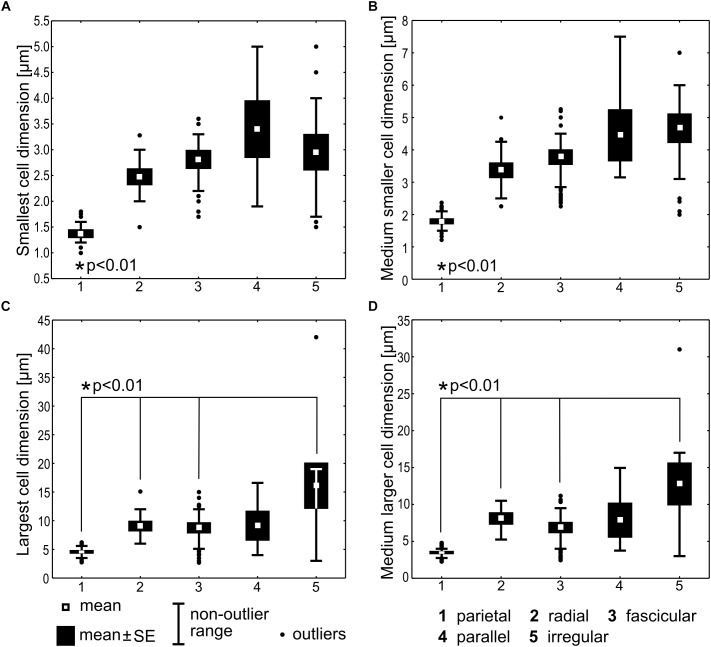
FIGURE 7.
Statistical comparison of cell dimensions across the types of thylakoid arrangement. The smallest cell dimension (A) represents the lower extreme of width (cylindrical cells) or length (discoid cells) interval for the particular strain. The medium smaller cell dimension (B) represents the middle value of this interval. The largest (C) and the medium larger (D) cell dimensions are analogous values (the upper extreme and the middle value, respectively) of the bigger cell diameter. Kruskal–Wallis test (N = 204, p < 0.001) was applied for testing the variance among thylakoid arrangement categories and two-tailed t-tests (p < 0.01) were used for pair-wise comparisons. Statistically significant differences are marked with asterisks.

