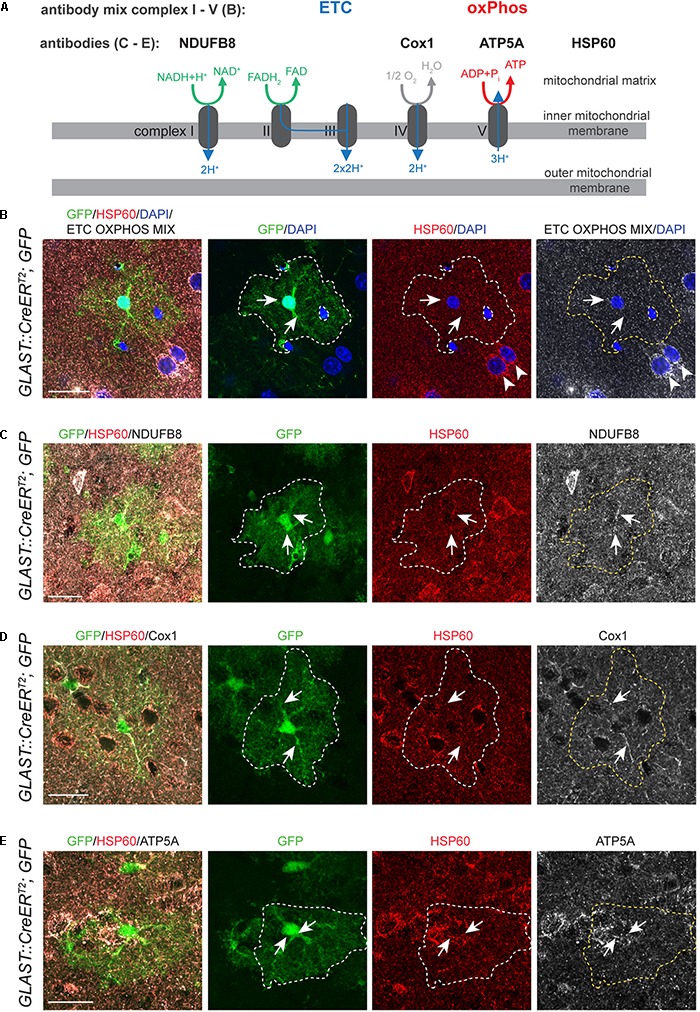
FIGURE 1.

Astrocytes express ETC and oxPhos components in vivo. (A) Schematic drawing illustrating localization and function of mitochondrial complexes of the electron transport chain (ETC) and oxidative phosphorylation (oxPhos); antibodies used in (B–E) to visualize expression of mitochondrial complex components are indicated. (B) DAPI was used to counterstain nuclei of glial and neuronal cells (arrowheads). (B–E) Glast::CreERT2;GFP mice labeled single astrocytes (green; outlined by white or yellow dotted line in all pictures except merge on the left); HSP60 labeled mitochondria (red); immunoreactivity for ETC OXPHOS MIX (B) and specific mitochondrial complex components NDUFB8 (C), Cox1 (D), ATP5A (E) shown in white. Immunostainings revealed that astrocytes in the cortex express all mitochondrial complex components tested (arrows in B–E). Pictures represent collapses of 2–3 confocal stacks. All scale bars = 20 μm.
