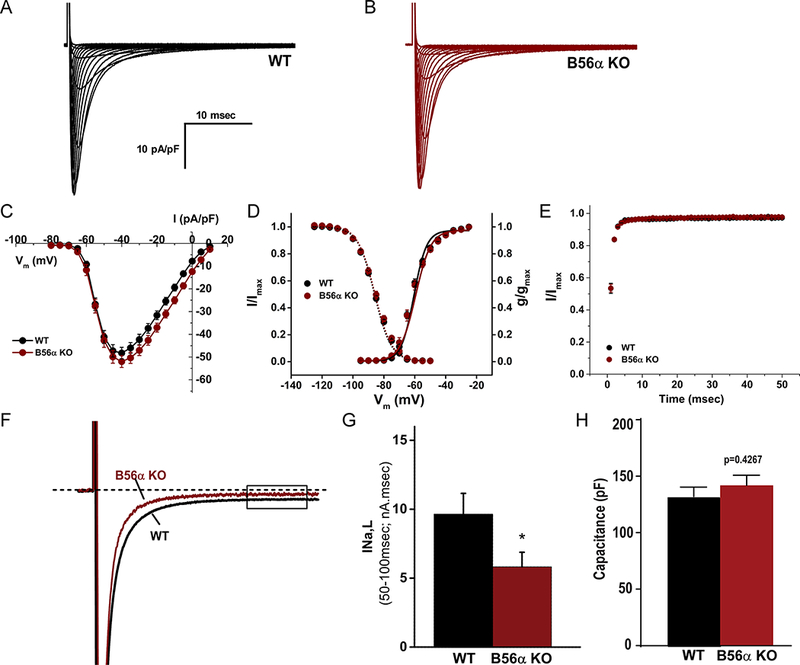
Figure 4. B56α KO myocytes display decreased INa,L.

(A-B) Representative recordings of whole cell INa from WT and B56α KO ventricular myocytes. (C) Current-voltage relationship, (D) voltage-dependent activation and voltage-dependent inactivation curves, and (E) time-dependent recovery of INa in WT and B56α KO ventricular myocytes. No significant difference was observed in peak INa at experimental voltages ranging from −60 to −15mV (p=N.S.), in V½ as determined by Boltzmann fits of the steady-state voltage-dependent inactivation (p=N.S.) and time-dependent recovery (p=N.S.; N=5,5, n=22,21 combined genders). (F) Representative INa,L traces from WT and B56α KO ventricular myocytes. (G) Quantification of INa,L from WT and B56α KO ventricular myocytes at baseline (WT, N=4; n=10 and B56α KO, N=4; n=9; *p<0.05). (H) No difference in cell capacitance was observed between WT and B56α KO myocytes (p=N.S.; shown for INa,L and INa experiments).
