Figure 2.
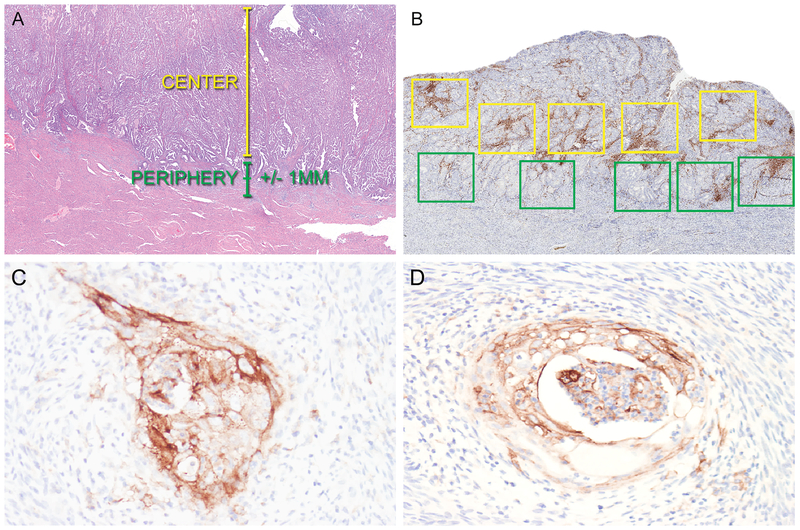
Photomicrographs demonstrating approach for quantification of tumor-associated lymphocytes and macrophages (A and B) and representative examples of PD-L1 expression in endometrioid endometrial adenocarcinoma (C and D). A. Representative H&E of an endometrial cancer to demonstrate definitions of tumor center and periphery. B. Quantification of CD3+, CD8+, and CD68+ cells in the tumor center and periphery was performed using Aperio whole slide imaging software. Five 1 mm2 boxes were placed at the tumor center (yellow boxes) and periphery (green boxes) in the areas of highest staining density by morphologic examination. Following quantification of positive cells in each box, mean positive cells/mm2 was calculated for the tumor center and periphery. C. Positive PD-L1 expression in the invasive front of an endometrial cancer. D. Positive PD-L1 expression in foci of squamous metaplasia in an endometrial cancer.

