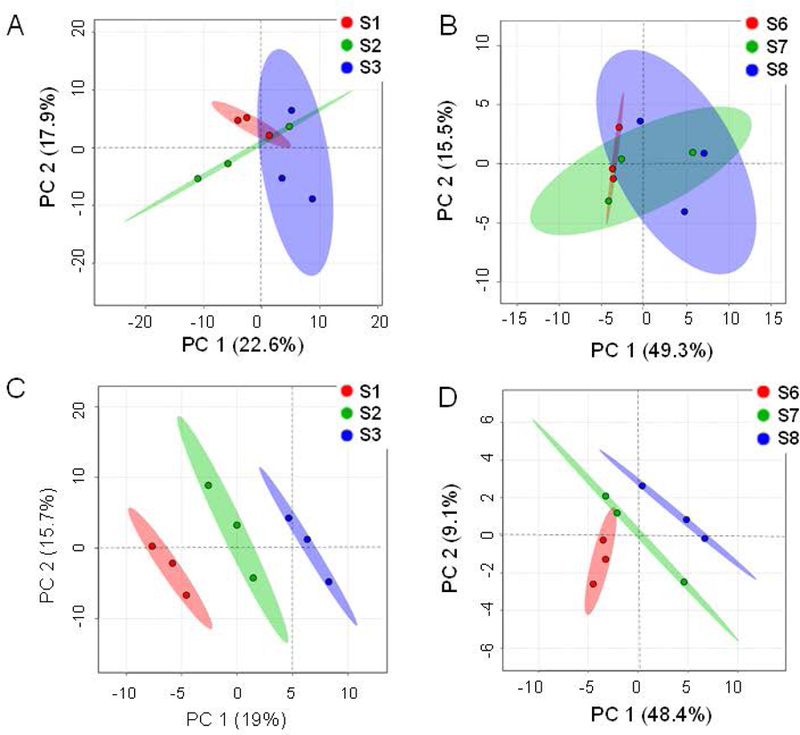
FIGURE 4.

Multivariate analysis of the metabolite abundance data. PCA score-plots for (A) 2D-GC/ToF-MS; first two PCs (PC1, PC2) could explain 40.5% of the variance for the metabolites quantified using the 2D-GC/ToF-MS platform and (B) 1D-GC/Orbitrap-MS datasets where the first two PCs could explain 64.8% of the total variance. The PLS-DA score plots for (C) 2D-GC-ToF-MS demonstrate that the first two PCS (PC1, PC2) could explain 34.7% of the variance and for (D) 1D-GC/Orbitrap-MS datasets, the first two PCs could explain 64.8% of the total variance. S1, S2, S3 were serum samples run by 2D-GC/ToF-MS and S6, S7, S8 were serum samples run by 1D-GC/Orbitrap-MS.
