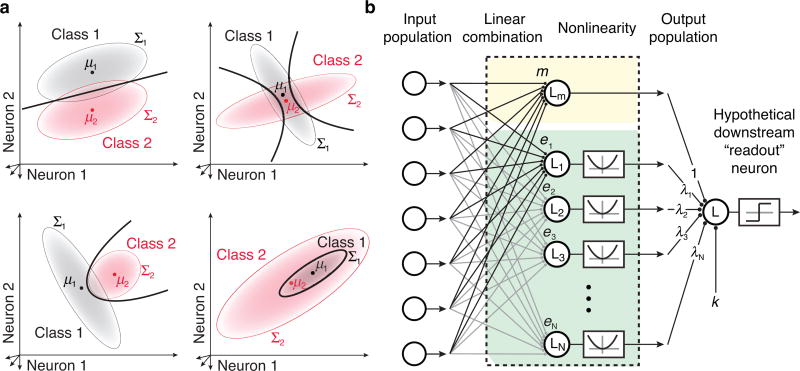
Figure 1. The nQDA framework.
a) Optimal quadratic discrimination boundaries (black lines) for four example pairs of population response distributions. Hypothetical class distributions are each multivariate Gaussian (indicated by red and gray elliptical regions), with means μ1 and μ2, and covariances Σ1 and Σ2. Top left: a scenario in which the means of the two classes differ and the covariances are matched. In this special case, the optimal classifier is linear; Top right: a scenario in which the means of the two classes are similar and a linear classifier alone is an ineffective decision boundary. Instead, the optimal classifier uses a pair of parabolic boundaries. Bottom left: an example with differing mean and covariance, yielding a single parabolic boundary. Bottom right: an example yielding an elliptical boundary. b) Depiction of the nQDA model, which implements the optimal quadratic classifier (Equations 3,4) as an LN-LN model (Equation 6). The first LN transformation is achieved with a bank of linear filters, with all but the first followed by a squaring nonlinearity. The outputs of these individual LN units are combined via a weighted sum, followed by a threshold function which determines the class membership.

