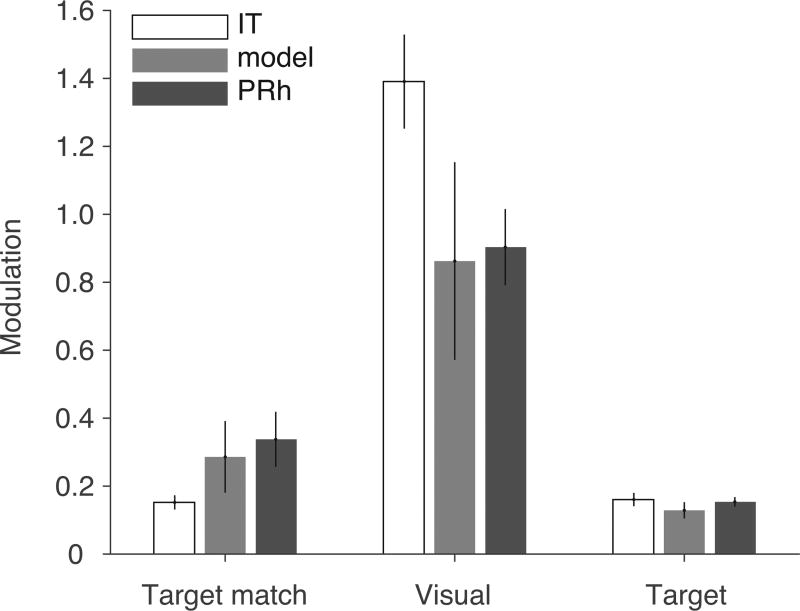
Figure 5. nQDA replicates differences in signal magnitudes between IT and PRh.
The responses of each neuron were decomposed into different types of task-relevant signals by quantifying, for each neuron, the amount of spike count variance (around the grand mean spike count) that could be attributed to changes in experimental conditions, including: “Target match” (whether a condition was a target match or distractor); “Visual” (image identity); and “Target” (target identity) (see Methods). These signal variances were then normalized by each neuron’s trial-by-trial variance, averaged across conditions, to obtain unitless quantities that reflect the ratio of each type of signal relative to the noise. Shown are the means and standard errors of these signal measures, computed for each population.

