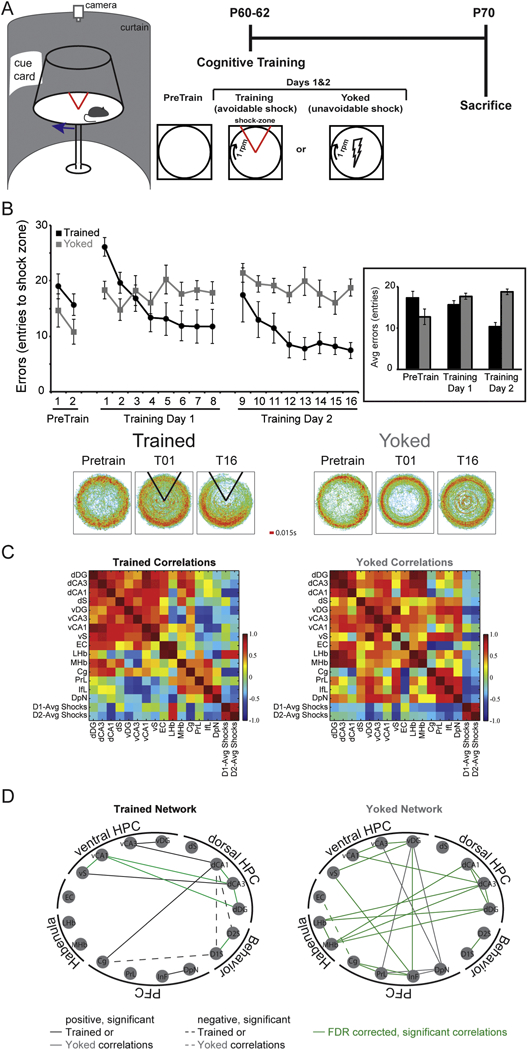
Figure 3. Different functional networks result from two experiences of one environment in normal rats.

A) In the two-frame active place avoidance paradigm, a rat is placed on a rotating arena (1 rpm) and required to use the room cues to avoid a shock zone that is stationary within the room. Because the arena rotates, the cues on the arena are irrelevant for the identification of the shock zone. During training, the rats quickly learn to avoid entering the shock zone where they would receive a mild foot shock (~0.3 mA). Rats were pre-exposed (Pretrain) to the arena and room conditions on a stationary arena. Twenty-four hours later, they were trained on the rotating arena in 10-min trials separated by a 10-min inter-trial interval. Eight trials were given each day for two days. To control for the experience of being shocked, a yoked group received the same exposure to the room and arena conditions, but inescapable shocks were delivered to the yoked rats in the same temporal sequence as the trained rats. One week after training concluded, the rats were euthanized by anesthesia and decapitation. Forty pm brain sections were then histologically processed as in (O’Reilly et al., 2016) with cytochrome c and catylase to create a diaminobenzidinetetrahydrochloride (DAB) stain. Optical density readings were then taken to examine cytochrome oxidase enzyme activity. B) Trained rats learn to reduce the number of entrances they make into the shock zone. Because the shocks are inescapable and occur at random locations for the yoked rats, the number of entrances into the same location within the room is not changed over time. Average dwell maps of the time spent in each location reveal that the time spent in the shock zone is reduced in trained animals but not in yoked controls. C) Color-coded correlation matrix of the interregional cytochrome oxidase activity correlations. The hot colors represent positive correlations and cool colors negative correlations. The correlations are organized by functional brain regions and include the number of shocks received on days 1 and 2. D) Significant correlations (p < 0.05) were used to generate graph theoretical networks. Each node represents a brain region and the lines represent significant correlations. Solid lines are positively correlated and dashed lines are negatively correlated. Trained animals have brain regions that are significantly correlated with the number of shocks they received, indicative of a relationship between place learning and brain activity, while yoked animals do not have significant correlations between any brain region and the number of shocks they received. Green lines represent correlations that remain significant after false discovery rate correction (FDR corrected) with an acceptable false discovery rate of 25%. HPC = hippocampus, PFC = prefrontal cortex, dDG = dorsal dentate gyrus, dCA3 = dorsal Cornu Ammonis region 3, dCA1 = dorsal Cornu Ammonis region 1, dS = dorsal subiculum, vDG = ventral dentate gyrus, vCA3 = ventral Cornu Ammonis region 3, vCA1 = ventral Cornu Ammonis region 1, vS = ventral subiculum, EC = entorhinal cortex, LHb = lateral habenula, MHb = medial habenula, Cg = cingulate cortex, PrL = prelimbic cortex, IfL = infralimbic cortex, DpN = dorsal peduncular nucleus, D1-Avg Shocks = average number of shocks received over the eight trials on day 1 of training, D2-Avg Shocks = average number of shocks received over the eight trials on day 2 of training.
