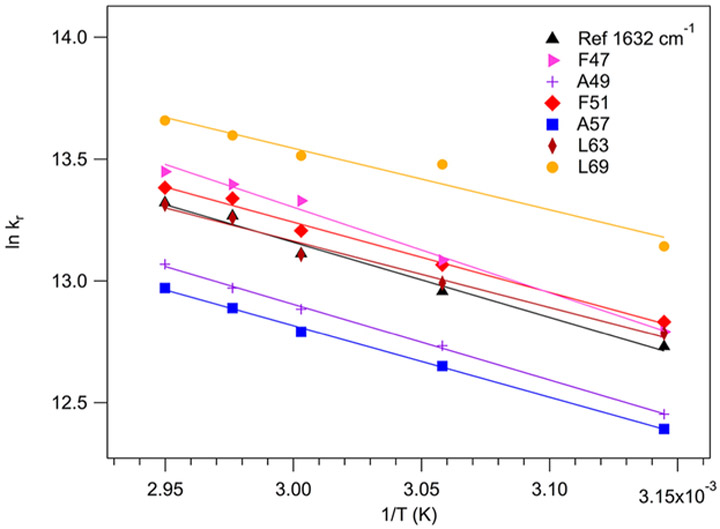
Figure 4.

Arrhenius plot of the observed relaxation rates as a function of inverse temperature for (13C═18O) F47, A49, F51, A57, L63, and L69 HP36. The unlabeled solvated helix rates (1631 cm−1) are also shown for reference.

Arrhenius plot of the observed relaxation rates as a function of inverse temperature for (13C═18O) F47, A49, F51, A57, L63, and L69 HP36. The unlabeled solvated helix rates (1631 cm−1) are also shown for reference.