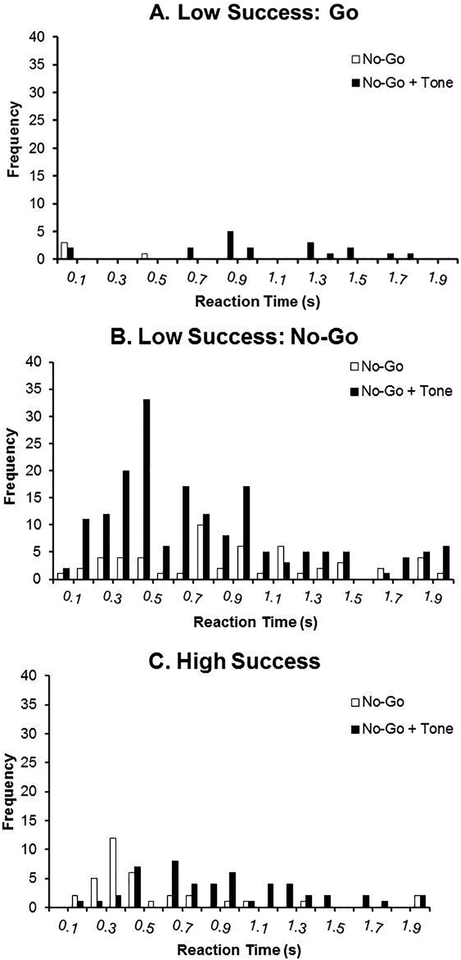
Figure 4. Reaction Times during the Go/No-Go Task and Tone Test: No-Go Trials.
Reaction times from all trials are presented for No-Go trials and separated into three groups: animals that exhibited low success specifically on Go trials during the Tone Test (Figure 4A), animals that exhibited low success specifically on No-Go trials during the Tone Test (Figure 4B), and animals that exhibited high success on both trials (Figure 4C). The frequency represents lever presses from all animals during the first 20 trials binned by 100 ms.

