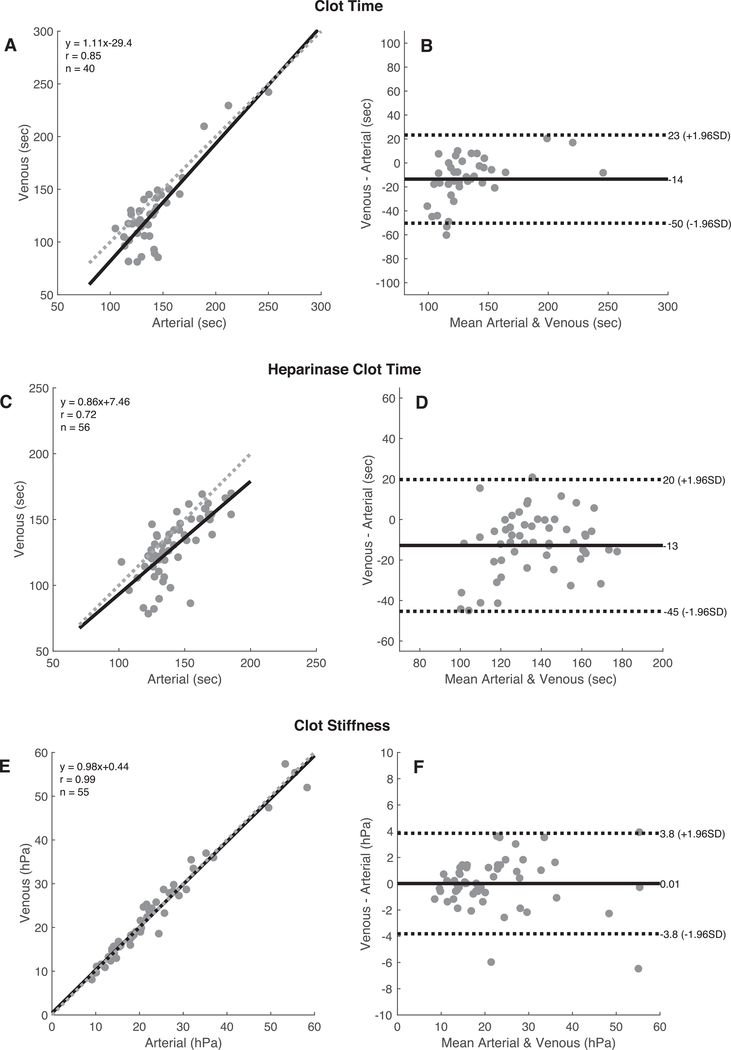
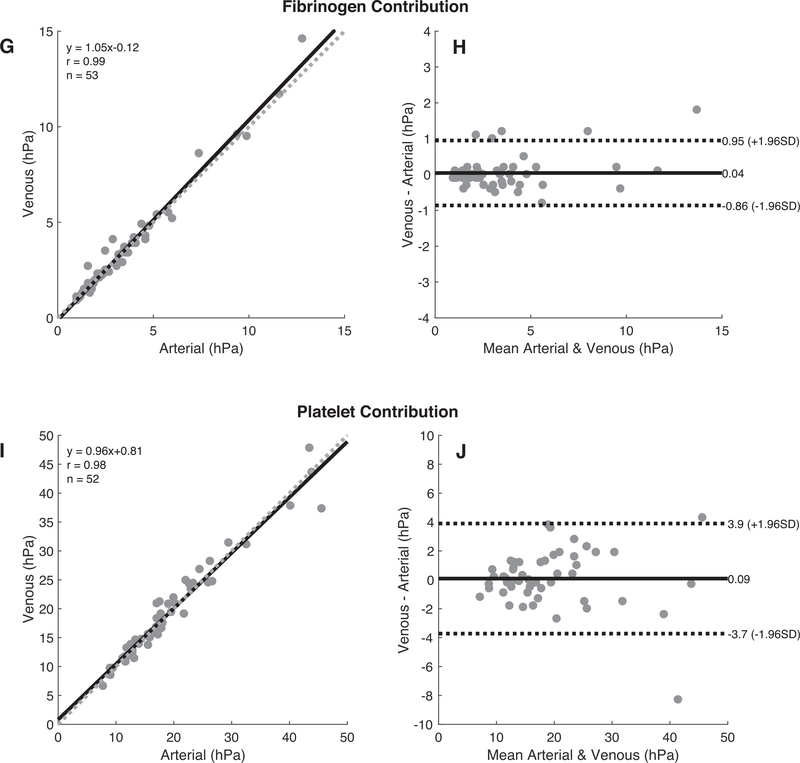
Fig. 2.
CorrelationandBland-AltmanplotsforthefollowingQuantraQPlusparameters: Clot Time(A and B), Heparinase Clot Time(C and D), Clot Stiffness (E and F), Fibrinogen Contribution to clot stiffness (G and H), and Platelet Contributions to clot stiffness (I and J). The correlation plots include the best linear fit line (solid line) and the unitary line (dotted line).


