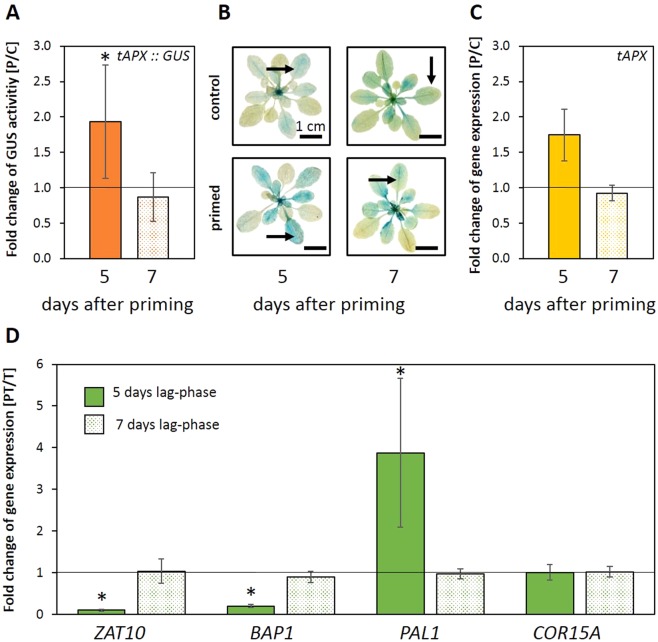
Figure 5.
The effect of a prolonged lag-phase of 7 days on primable genes and tAPX expression. (A) Quantification of GUS activity in 4-week-old rosettes 5 (orange bar) or 7 (dotted bar) days after priming, respectively. The graph depicts the specific activity in primed plants at the end of the lag-phase relative to the specific activity in control plants (n = 10; mean ± SD, * t-Test p < 0.05. (B) Representative GUS staining pattern of tAPXprom::GUS plants (n = 10) 5 or 7 days after cold-priming and in control plants. The arrows marks the leaf stage that was used for the quantification of GUS activity. (C) Comparison of the normalized tAPX transcript abundance 5 and 7 days after priming relative to the transcript levels in control plants (n = 3; mean ± SD, * one-sided t-Test p < 0.05). (D) Normalized transcript levels of ZAT10, BAP1, PAL1 and COR15A in PT-plants relative to T-plants at the time-point directly after the end of the triggering stimulus after a lag-phase length of either 5 days (green bar) or 7 days (dotted bar) (n = 3; mean ± SD, * one-sided t-Test p < 0.05).

