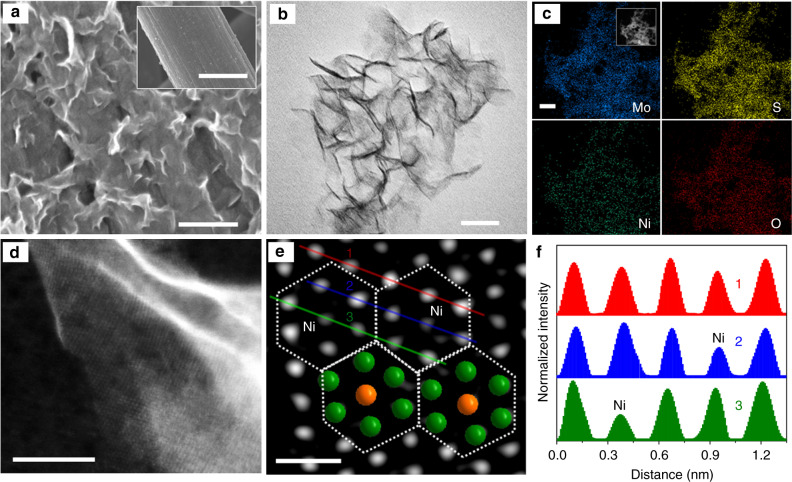
Fig. 2.
Structure characterizations of NiO@1T-MoS2. a SEM image, scale bar: 200 nm (inset: low magnification SEM image, scale bar: 5 μm). b TEM image (scale bar: 20 nm). c EDX mappings (scale bar: 1 μm). d High-angle annular dark-field (HAADF) STEM image (scale bar: 5 nm). e Aberration-corrected atomic resolution HAADF-STEM image (scale bar: 0.5 nm). The white dotted hexagons show the NiMo6 units in NiO@1T-MoS2 (green: Mo; orange: Ni). f Intensity profiles along the lines indicated in image e

