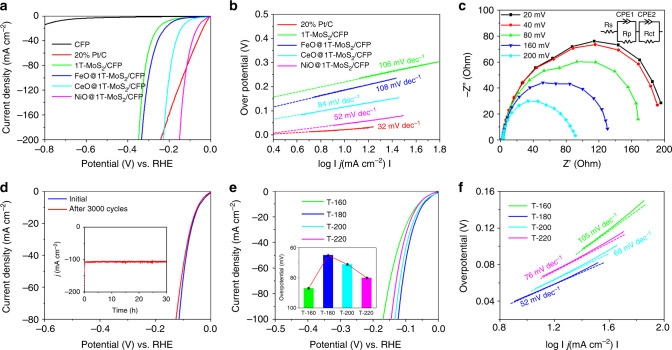
Fig. 5.
HER catalytic performances and EIS responses for NiO@1T-MoS2. a Polarization curve of all catalysts in 1.0 M KOH (scan rate: 5 mV s−1 under a three-electrode configuration). b Tafel plots. c Electrochemical impedance spectroscopy (EIS) of NiO@1T-MoS2 at various overpotentials. d Stability tests of NiO@1T-MoS2 (inset: the long-term durability tests at η = 130 mV for 30 h). e Polarization curves (inset: overpotentials to drive 20 mA cm−2). f The corresponding Tafel slopes of NiO@1T-MoS2 synthesized at various temperatures: 160 °C (T-160), 180 °C (T-180), 200 °C (T-200), and 220 °C (T-220) samples

