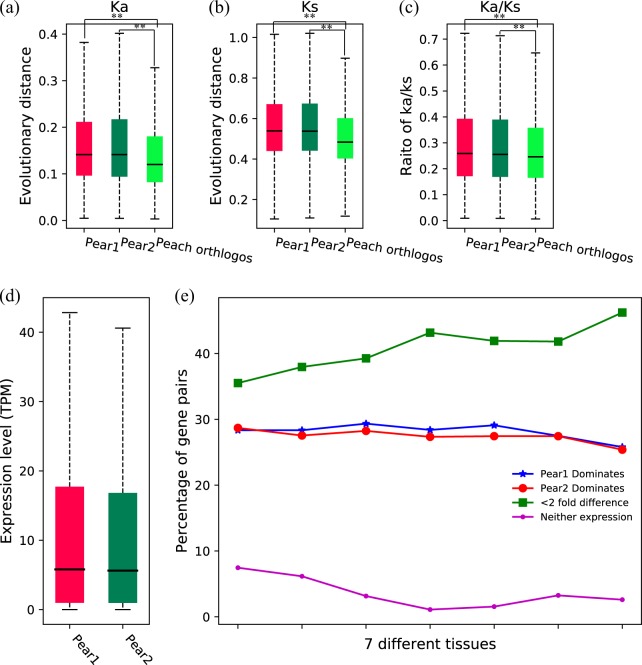
Fig. 3. Comparison of evolutionary rates and expression patterns between pear subgenome 1 and subgenome 2.
a–c Comparison of Ka, Ks, and Ka/Ks between genes in each pear subgenome and their orthologous genes in peach. Ka, Ks, and Ka/Ks values were estimated by pairwise comparison of orthologous genes between pear or peach and strawberry. d–e Comparison of overall expression level between the two subgenomes and the expression pattern of homeologous gene pairs in different pear tissues. Mann–Whitney U test was used for statistical analysis. *p-value < 0.05. **p-value < 0.01

