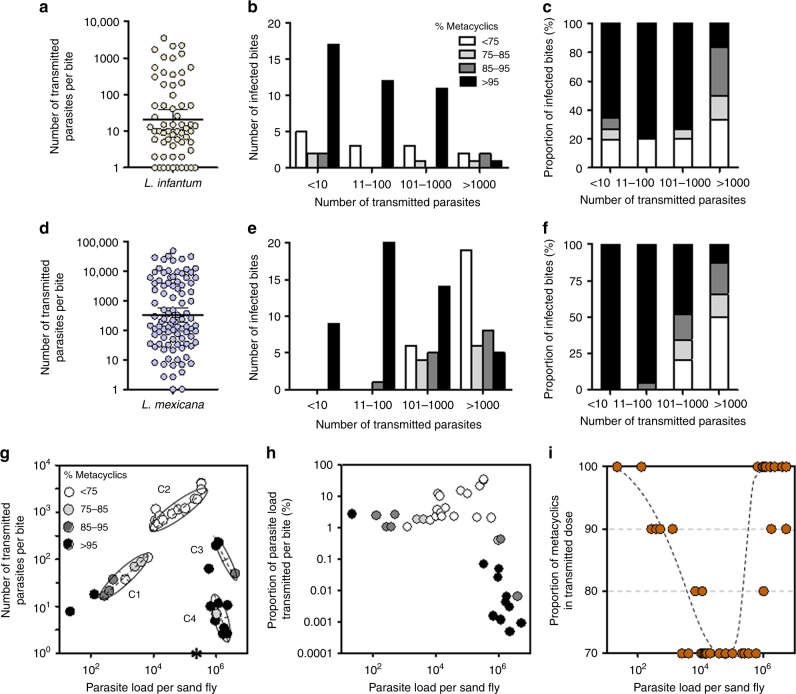
Fig. 2.
Composition of infective dose from individual sandfly bites. a–i Lutzomyia longipalpis sandflies were infected and allowed to bite the ear of a BALB/c mouse once at 10 days p.i. for L. infantum (a–c) or 8 days p.i. for L. mexicana (d–h). Each bite was assessed for the total number of parasites by ssrRNA RTqPCR (a, d) and the proportion of metacyclics by sherp RTqPCR (b, c, e–i). Thick solid lines represent geometric means ± 95% C.I. g The relationship between the quantity of L. mexicana parasites in the prefed midgut of Lu. longipalpis and the infectious dose transmitted by each fly. Two-dimensional Gaussian mixture cluster analysis identifies 4 clusters centred on the mean, plotted as an ellipse representing the standard deviation. The asterisk on the x-axis represents the infection of one fly from this subset that didn’t transmit any parasites. h The parasite dose as a function of the midgut infection intensity. The relationship between the pre-feeding parasite load of flies in g and the proportion of the load transmitted. g, h The proportion of metacyclics delivered by each fly bites was determined and is presented as different coloured symbols. i The quality of parasite dose as a function of midgut infection intensity. The dashed black line represents a loess curve of the data points. Data for (a–f) are pooled from 4 independent experiments. Results from (g–i) are from 1 experiment

