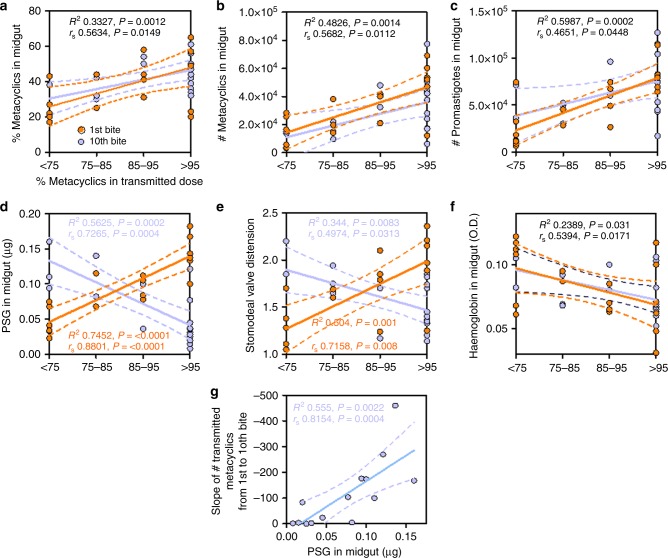
Fig. 5.
Correlates of sandfly infection with dose composition. a–g Following the 1st or 10th infectious bite, L. mexicana-infected Lu. longipalpis sandflies were dissected and their parasite infections assessed. For each fly the proportion of metacyclics in the infectious dose is plotted against: (a) the percentage and (b) total number of metacyclics in the midgut of prefeed flies, (c) total midgut parasite burden in prefeed infected flies, (d) the relative quantity of PSG in the midgut remaining after the feed, (e) distension of the stomodeal valve (compared to age-matched, bloodfed, uninfected flies) and f the quantity of haemoglobin imbibed. Results in orange are from flies allowed to bite once and blue for flies allowed to bite 10 times. g Transmitted dose as a function of the PSG blockage in the midgut. The slope of the number of metacyclics transmitted from the 1st to the 10th bite of flies allowed to bite 10 times is plotted against the relative quantity of PSG remaining in the midgut after the last bite. Data pooled from 4 independent experiments. Solid lines represent linear regression line of best fit and dotted lines represent the 95% confidence interval. Correlation coefficients were generated by Spearman-rank correlation and are colour-coded. Those in black represent correlation coefficients from the combination of single- and 10-bite flies due to their similarity

