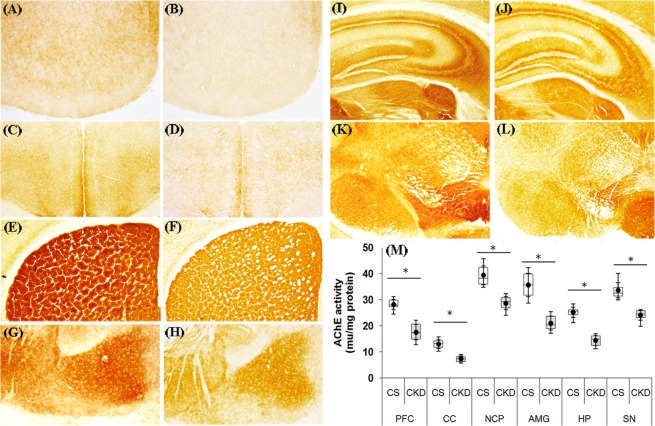
Figure 6.
Acetylcholinesterase (AChE) activity in different brain regions of control (CS) and chronic kidney disease (CKD) mice. Representative sections of AChE histoenzymology in different brain regions: (A,B) prefrontal cortex (PFC), (C,D) cerebral cortex (CC), (E,F) striatum (NCP), (G,H) amygdala (AMG), (I,J) hippocampus (HP) and (K,L) substantia nigra (SN). 20 µm thick sections from glycerol perfused brain were stained for AChE histoenzymology. The activity of the enzyme AChE, indicated by colour intensity, was found to be decreased in all the brain regions of CKD mice (B,D,F,H,J,L), compared to CS (A,C,E,G,I,K). Photographs were taken under bright field illumination at 4× magnification. The activity of AChE (in mu/mg protein) in the brain tissue homogenates from the same regions was also estimated following Ellman method. (M) Distribution of AChE activity values in different groups – CS and CKD shown as box plot. The box extends from 25th to 75th percentile, the horizontal line inside the box represent median, and the whiskers delimit minimum to maximum values. The dot within the box represents the mean of the group with 95% confidence interval denoted by error bars. An unpaired Student’s t-test (two-tailed) was used to calculate P-values.*P ≤ 0.05 as compared to CS was considered statistically significant (n = 6).

