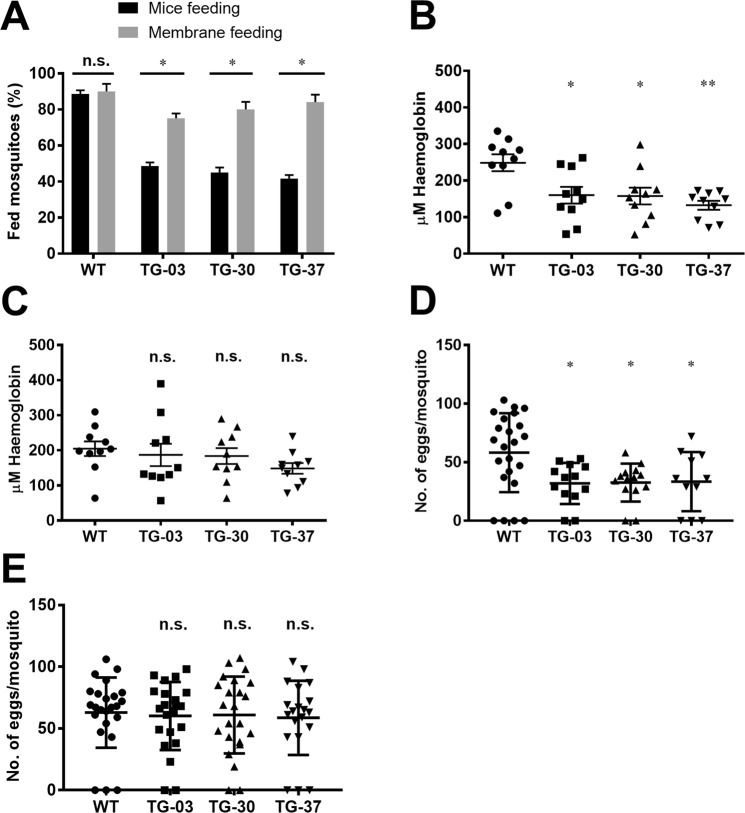
Figure 5.
Feeding success of TG mosquitoes on direct mouse feeding and artificial membrane feeding. (A) Feeding success of WT and TG mosquitoes both on naïve mice (Black bar) and artificial membrane feeding (Gray bar) for 10 min blood feeding. Percentage of successful feeding were analyzed by using a Chi-square test with 95% CI. (B,C) The size of blood meal ingested by mosquitoes that fed for 10 min on mice (B) or artificial membrane feeder (C) determined by the total hemoglobin contents in the abdomens of mosquitoes. (D,E) Fecundity rate (egg laying) of WT and TG mosquitoes both on mice (D) and artificial membrane feeding (E) for 10 min blood feeding. Results were analyzed by the Dunnett’s multiple comparisons test. Horizontal bars represent the median value. *p < 0.05, **p < 0.01, ***p < 0.001, ****p < 0.0001. n.s., not significant.

